
A Leading Provider of Real Estate Capital To State-Licensed Cannabis Operators March 11, 2024
newlake.comOTCQX: NLCP 2 This presentation has been prepared by the NewLake Capital Partners, Inc. (“we,” “us” or the “Company”) solely for informational purposes. This presentation and related discussion shall not constitute an offer to sell or the solicitation of an offer to buy, nor shall there be any sale of securities. This presentation contains forward‐looking statements within the meaning of the U.S. Private Securities Litigation Reform Act of 1995. These statements can be identified by the fact that they do not relate strictly to historical or current facts, and are often indicated by words such as “anticipates,” estimates,” “expects,” “intends,” “plans,” “believes” and similar expressions or future or conditional verbs such as “will,” “should,” “would,” “may” “and “could.” Forward looking statements include, among others, statements relating to the Company’s future financial performance, business prospects and strategy, the use of proceeds from our initial public offering, future dividend payments, anticipated financial position, the Company’s acquisition pipeline, liquidity and capital needs and other similar matters. These statements are based on the Company’s current expectations and assumptions about future events, which are inherently subject to uncertainties, risks and changes in circumstances that are difficult to predict. The Company’s actual results may differ materially from those expressed in, or implied by, the forward looking statements. The Company is providing the information contained herein as of the date of this presentation. Except as required by applicable law, the Company does not plan to update or revise any statements contained herein, whether as a result of any new information, future events, changed circumstances or otherwise. Safe Harbor Statement Use of Non-GAAP Financial Information Adjusted Funds From Operations (“AFFO”) is a supplemental non-GAAP financial measure used in the real estate industry to measure and compare the operating performance of real estate companies. A complete reconciliation containing adjustments from GAAP net income attributable to common stockholders and participating securities to AFFO are included in the appendix to this presentation.
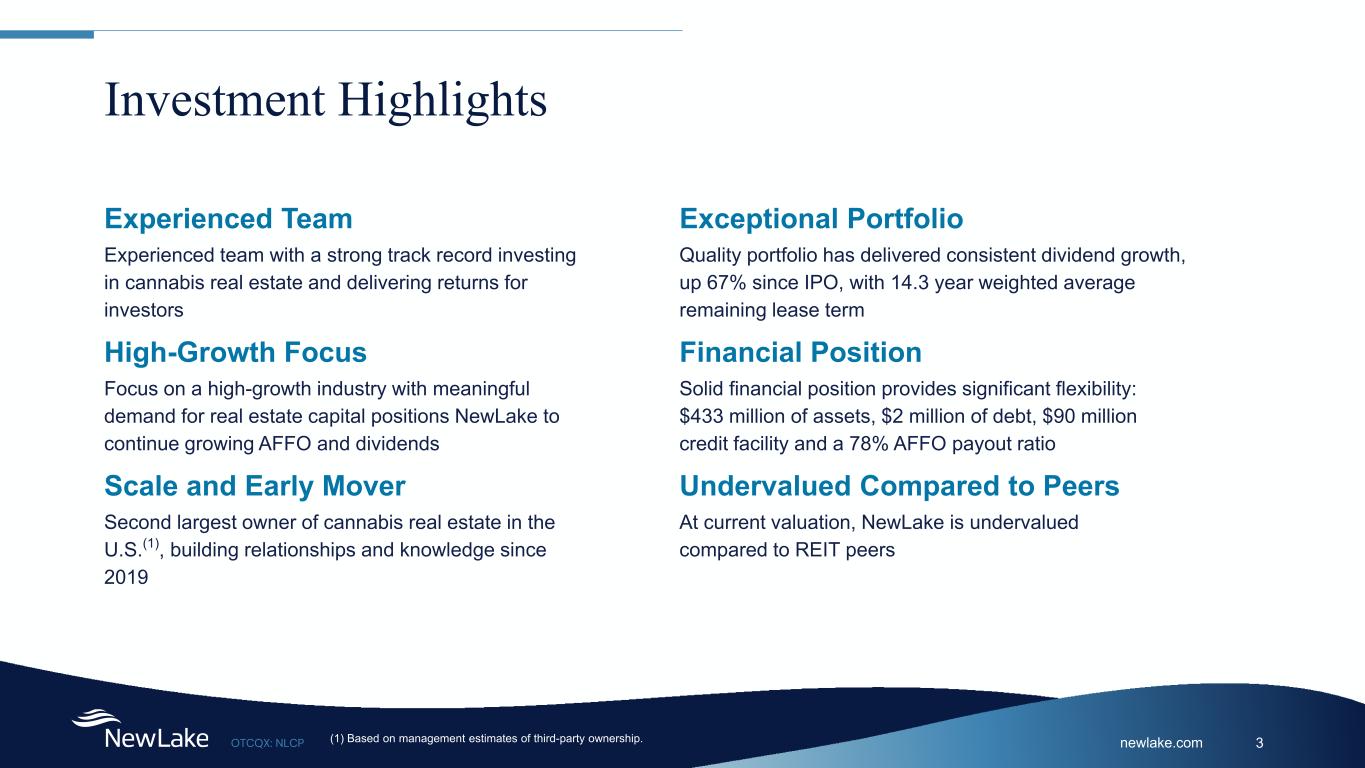
newlake.comOTCQX: NLCP 3 Investment Highlights Experienced Team Experienced team with a strong track record investing in cannabis real estate and delivering returns for investors High-Growth Focus Focus on a high-growth industry with meaningful demand for real estate capital positions NewLake to continue growing AFFO and dividends Scale and Early Mover Second largest owner of cannabis real estate in the U.S.(1), building relationships and knowledge since 2019 Exceptional Portfolio Quality portfolio has delivered consistent dividend growth, up 67% since IPO, with 14.3 year weighted average remaining lease term Financial Position Solid financial position provides significant flexibility: $433 million of assets, $2 million of debt, $90 million credit facility and a 78% AFFO payout ratio Undervalued Compared to Peers At current valuation, NewLake is undervalued compared to REIT peers (1) Based on management estimates of third-party ownership.
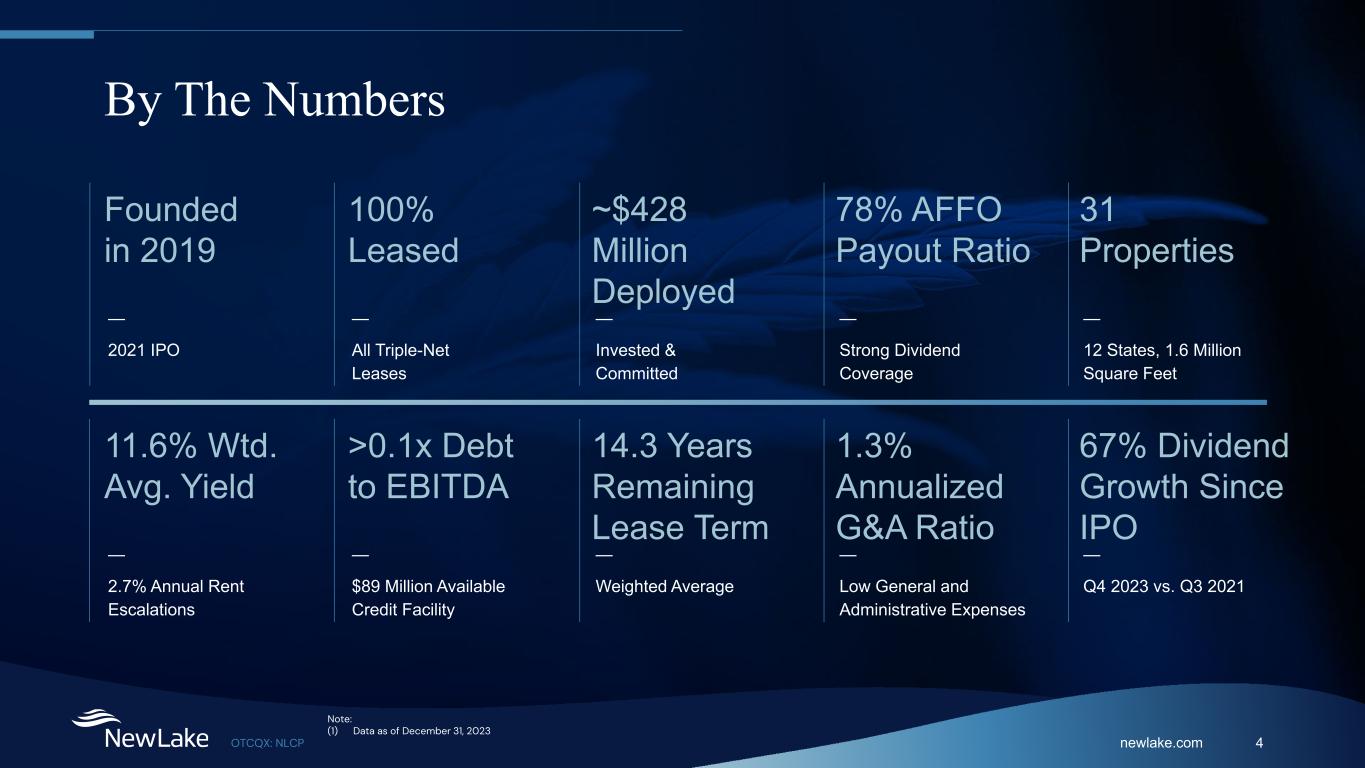
newlake.comOTCQX: NLCP 4 By The Numbers 100% Leased — All Triple-Net Leases Founded in 2019 — 2021 IPO ~$428 Million Deployed — Invested & Committed 78% AFFO Payout Ratio — Strong Dividend Coverage 31 Properties — 12 States, 1.6 Million Square Feet >0.1x Debt to EBITDA — $89 Million Available Credit Facility 11.6% Wtd. Avg. Yield — 2.7% Annual Rent Escalations Note: (1) Data as of December 31, 2023 1.3% Annualized G&A Ratio — Low General and Administrative Expenses 14.3 Years Remaining Lease Term — Weighted Average 67% Dividend Growth Since IPO — Q4 2023 vs. Q3 2021
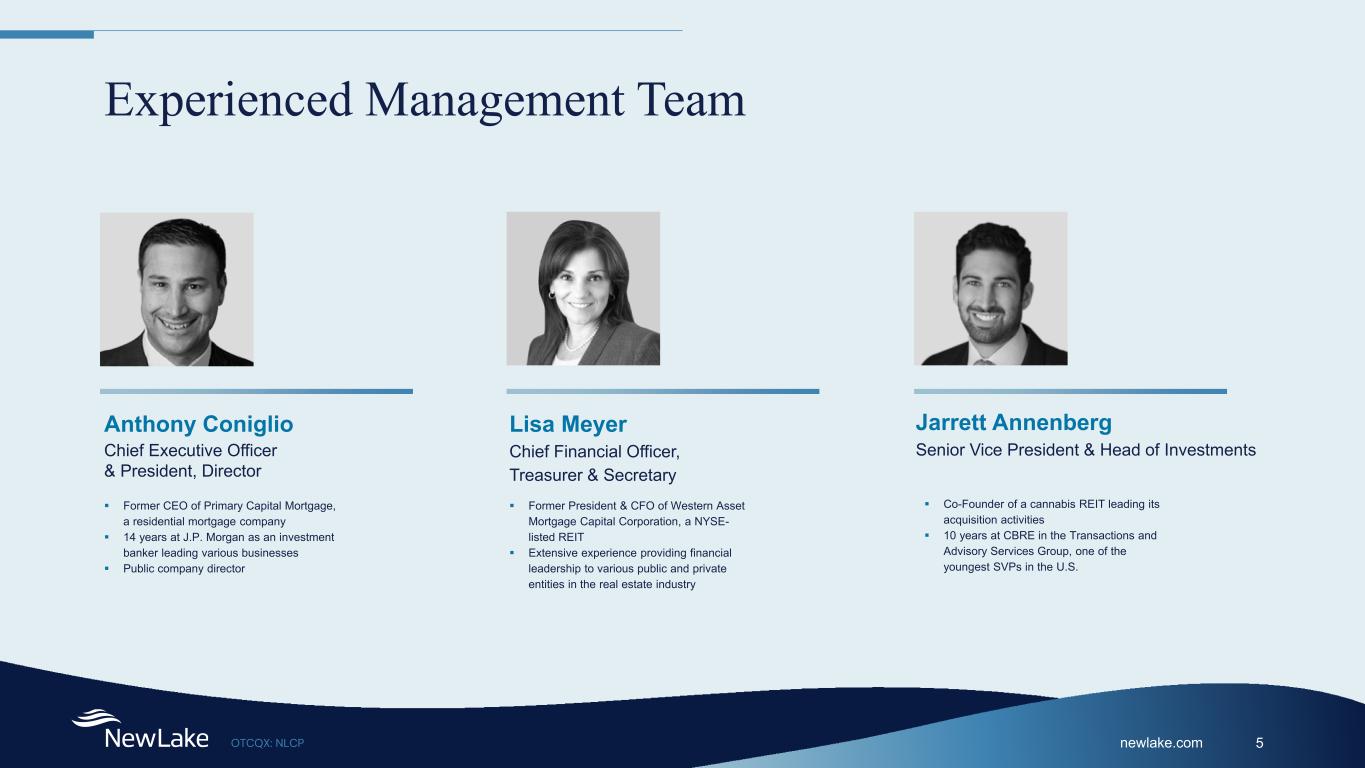
newlake.comOTCQX: NLCP 5 Experienced Management Team Anthony Coniglio Chief Executive Officer & President, Director Lisa Meyer Chief Financial Officer, Treasurer & Secretary Jarrett Annenberg Senior Vice President & Head of Investments Former CEO of Primary Capital Mortgage, a residential mortgage company 14 years at J.P. Morgan as an investment banker leading various businesses Public company director Former President & CFO of Western Asset Mortgage Capital Corporation, a NYSE- listed REIT Extensive experience providing financial leadership to various public and private entities in the real estate industry Co-Founder of a cannabis REIT leading its acquisition activities 10 years at CBRE in the Transactions and Advisory Services Group, one of the youngest SVPs in the U.S.

newlake.comOTCQX: NLCP 6 Experienced Board of Directors Gordon DuGan Chairman of the Board, Independent Director Alan Carr Independent Director Joyce Johnson Independent Director Co-Founder and Chairman of the Board of Blackbrook Capital Former Chairman of the Board of INDUS Realty Trust (Nasdaq: INDT) Former CEO of Gramercy Property Trust, a NYSE-listed triple-net lease REIT Former CEO of W.P. Carey & CO., a NYSE- listed triple-net lease REIT Director on several boards in diverse industries including Sears Holdings Corporation and Unit Corporation. Former Managing Director at Strategic Value Partners investing in various sectors in North America and Europe Chairman of Pacific Gate Capital Management, LLC, an investment firm Former Senior Managing Director and Partner of Relativity Capital, LLC and Managing Director of Cerberus Capital Management, L.P. Lead Independent Director at Ayr Wellness Experienced board member for 22 companies

newlake.comOTCQX: NLCP 7 Experienced Board of Directors Continued Peter Kadens Independent Director Peter Martay Independent Director David Weinstein Director Co-Founder and former CEO of Green Thumb Industries, Inc., one of the leading public cannabis companies Co-Founder and former CEO of SoCore Energy, one of the largest commercial solar companies in the U.S. Former Director of KushCo Holdings, Inc. (OTCQX: KSHB) and Choice Consolidation Corp., a SPAC targeting cannabis businesses CEO of Pangea Properties, a private apartment REIT that owned more than 13,000 apartments and completed over $300 million in short term bridge loans on numerous property types across the U.S. Former banker at Bernstein Global Wealth Management, Glencoe Capital and Deutsche Bank CEO of NewLake from August 2020 – July 2022, Director Since 2019 Former CEO of MPG Office Trust, a NYSE-listed office REIT 10 years at Goldman Sachs as a real estate investment banker and investor 10 years at Belvedere Capital, a real estate investment firm
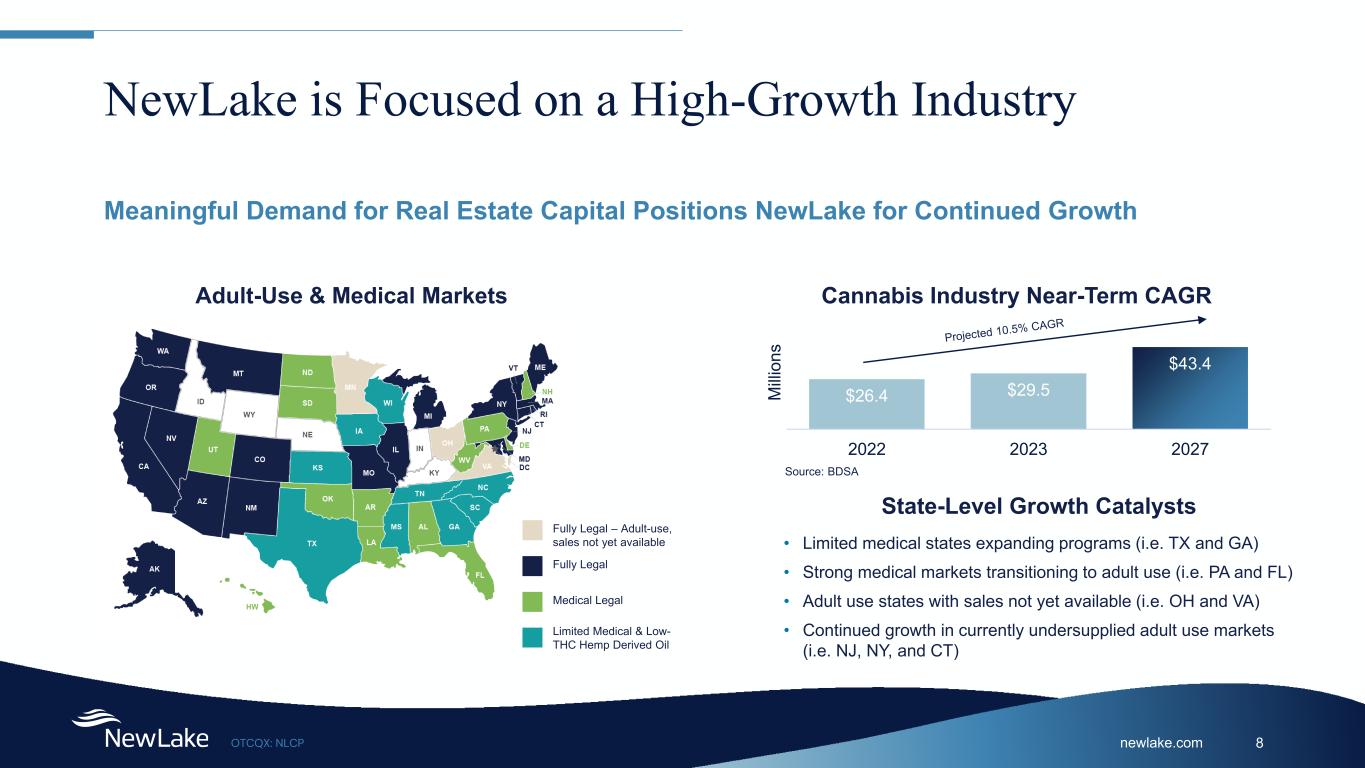
newlake.comOTCQX: NLCP 8 NewLake is Focused on a High-Growth Industry Meaningful Demand for Real Estate Capital Positions NewLake for Continued Growth Adult-Use & Medical Markets Fully Legal – Adult-use, sales not yet available Fully Legal Medical Legal Limited Medical & Low- THC Hemp Derived Oil $26.4 $29.5 $43.4 2022 2023 2027 M illi on s Cannabis Industry Near-Term CAGR Source: BDSA • Limited medical states expanding programs (i.e. TX and GA) • Strong medical markets transitioning to adult use (i.e. PA and FL) • Adult use states with sales not yet available (i.e. OH and VA) • Continued growth in currently undersupplied adult use markets (i.e. NJ, NY, and CT) State-Level Growth Catalysts
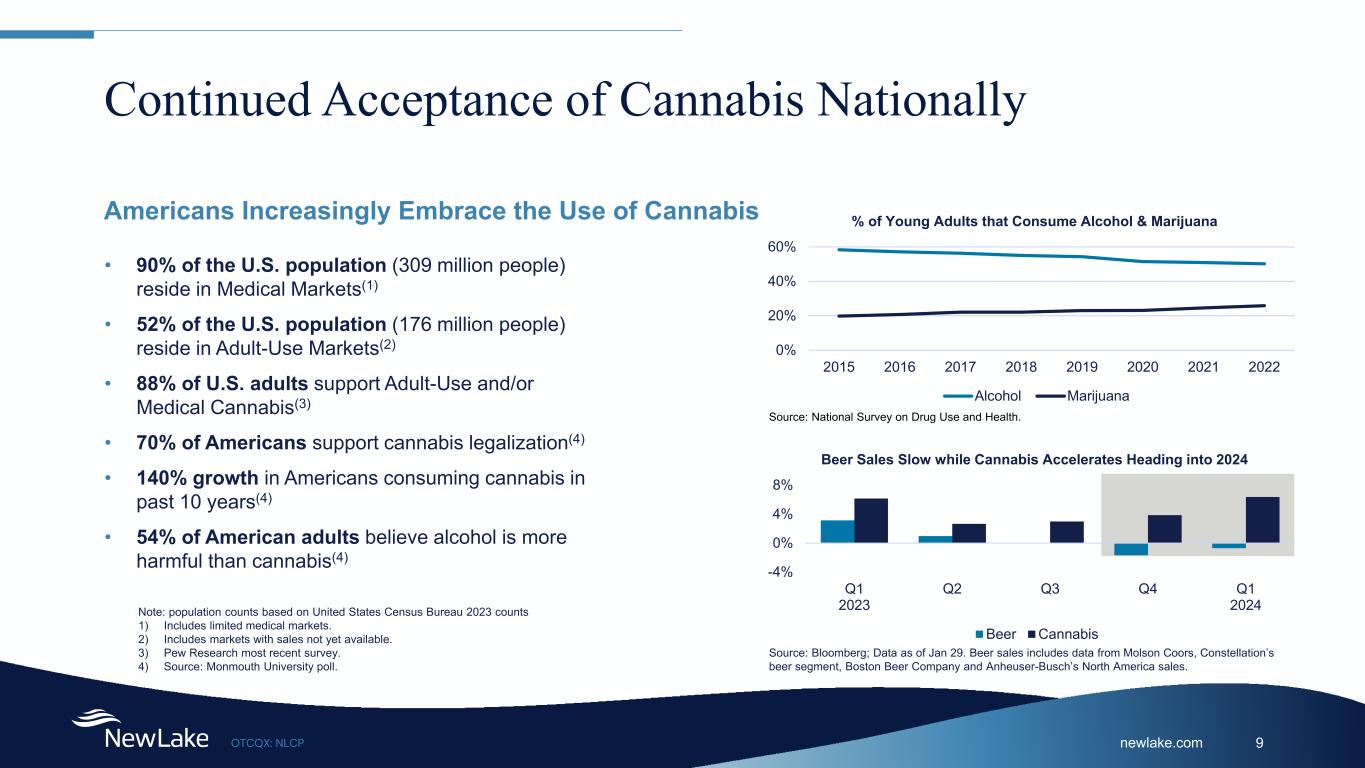
newlake.comOTCQX: NLCP 9 Continued Acceptance of Cannabis Nationally Americans Increasingly Embrace the Use of Cannabis 0% 20% 40% 60% 2015 2016 2017 2018 2019 2020 2021 2022 % of Young Adults that Consume Alcohol & Marijuana Alcohol Marijuana • 90% of the U.S. population (309 million people) reside in Medical Markets(1) • 52% of the U.S. population (176 million people) reside in Adult-Use Markets(2) • 88% of U.S. adults support Adult-Use and/or Medical Cannabis(3) • 70% of Americans support cannabis legalization(4) • 140% growth in Americans consuming cannabis in past 10 years(4) • 54% of American adults believe alcohol is more harmful than cannabis(4) -4% 0% 4% 8% Q1 2023 Q2 Q3 Q4 Q1 2024 Beer Sales Slow while Cannabis Accelerates Heading into 2024 Beer Cannabis Source: National Survey on Drug Use and Health. Source: Bloomberg; Data as of Jan 29. Beer sales includes data from Molson Coors, Constellation’s beer segment, Boston Beer Company and Anheuser-Busch’s North America sales. Note: population counts based on United States Census Bureau 2023 counts 1) Includes limited medical markets. 2) Includes markets with sales not yet available. 3) Pew Research most recent survey. 4) Source: Monmouth University poll.
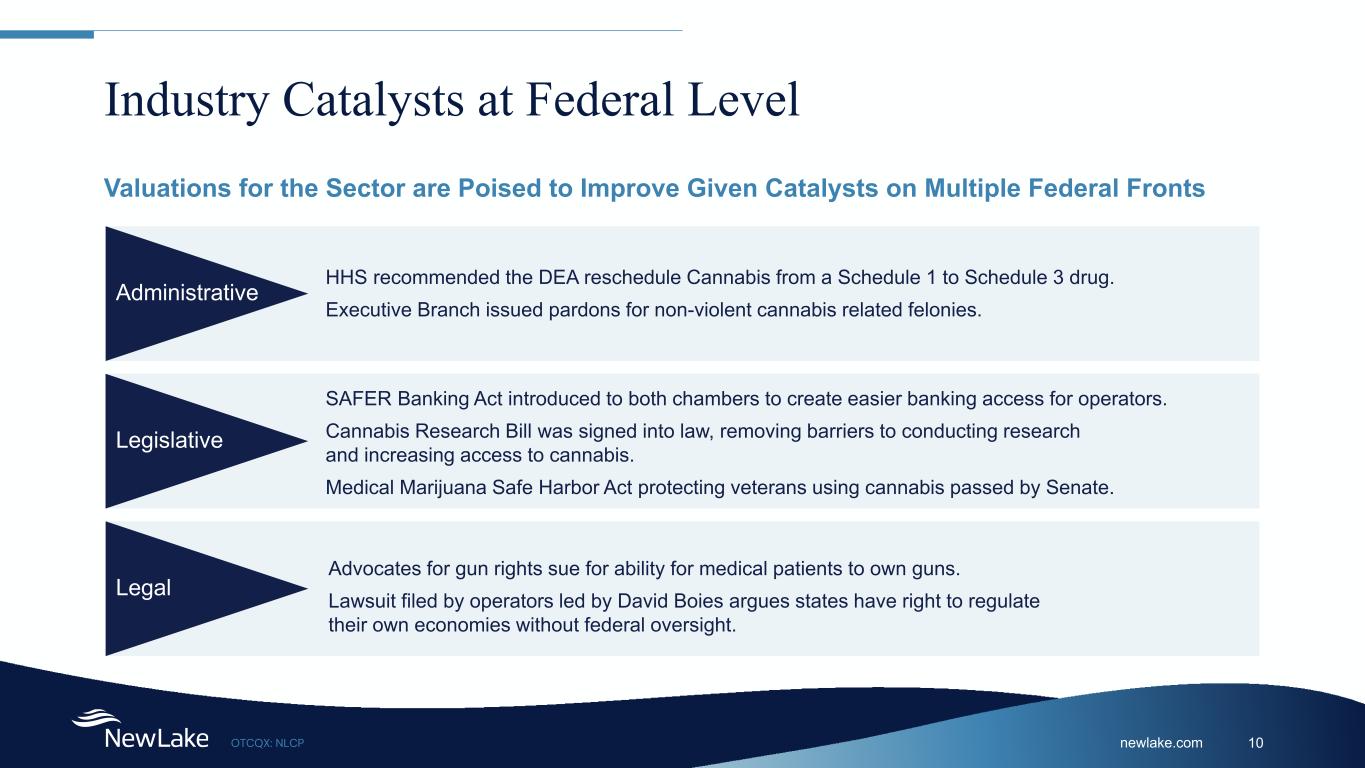
newlake.comOTCQX: NLCP 10 Industry Catalysts at Federal Level Legislative SAFER Banking Act introduced to both chambers to create easier banking access for operators. Cannabis Research Bill was signed into law, removing barriers to conducting research and increasing access to cannabis. Medical Marijuana Safe Harbor Act protecting veterans using cannabis passed by Senate. Administrative HHS recommended the DEA reschedule Cannabis from a Schedule 1 to Schedule 3 drug. Executive Branch issued pardons for non-violent cannabis related felonies. Legal Advocates for gun rights sue for ability for medical patients to own guns. Lawsuit filed by operators led by David Boies argues states have right to regulate their own economies without federal oversight. Valuations for the Sector are Poised to Improve Given Catalysts on Multiple Federal Fronts
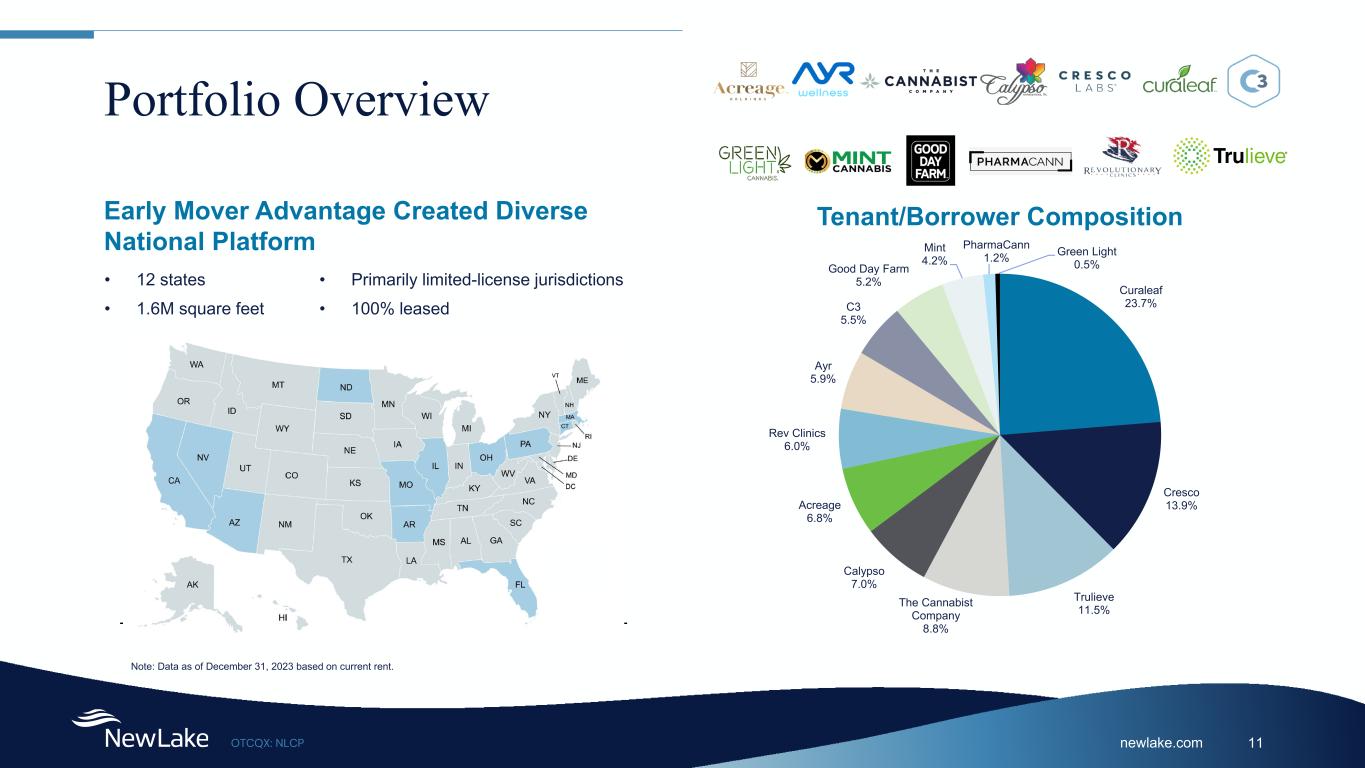
newlake.comOTCQX: NLCP 11 Portfolio Overview Early Mover Advantage Created Diverse National Platform • 12 states • 1.6M square feet • Primarily limited-license jurisdictions • 100% leased Note: Data as of December 31, 2023 based on current rent. Curaleaf 23.7% Cresco 13.9% Trulieve 11.5%The Cannabist Company 8.8% Calypso 7.0% Acreage 6.8% Rev Clinics 6.0% Ayr 5.9% C3 5.5% Good Day Farm 5.2% Mint 4.2% PharmaCann 1.2% Green Light 0.5% Tenant/Borrower Composition
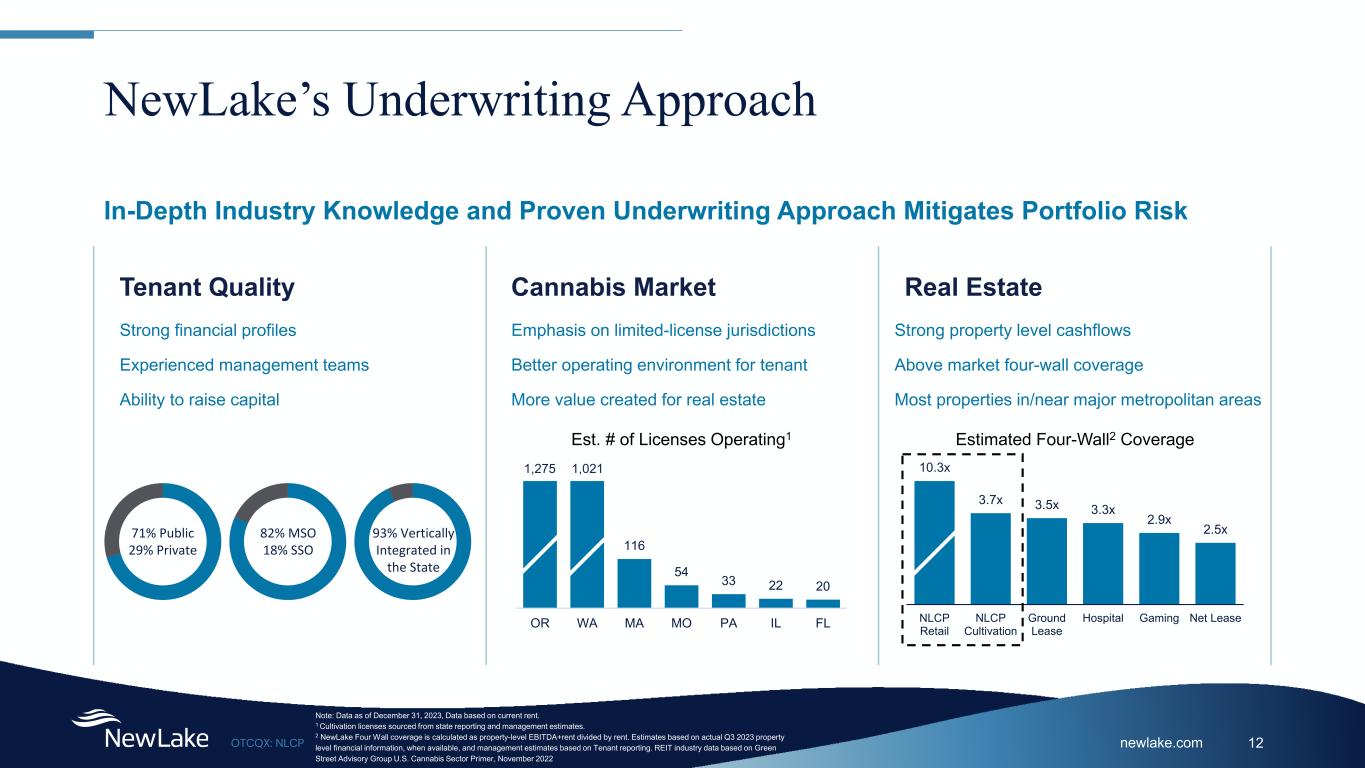
newlake.comOTCQX: NLCP 12 3.7x 3.5x 3.3x 2.9x 2.5x NLCP Retail NLCP Cultivation Ground Lease Hospital Gaming Net Lease NewLake’s Underwriting Approach Tenant Quality Real Estate In-Depth Industry Knowledge and Proven Underwriting Approach Mitigates Portfolio Risk Strong financial profiles Experienced management teams Ability to raise capital Strong property level cashflows Above market four-wall coverage Most properties in/near major metropolitan areas Estimated Four-Wall2 Coverage Note: Data as of December 31, 2023, Data based on current rent. 1 Cultivation licenses sourced from state reporting and management estimates. 2 NewLake Four Wall coverage is calculated as property-level EBITDA+rent divided by rent. Estimates based on actual Q3 2023 property level financial information, when available, and management estimates based on Tenant reporting. REIT industry data based on Green Street Advisory Group U.S. Cannabis Sector Primer, November 2022 71% Public 29% Private 82% MSO 18% SSO 93% Vertically Integrated in the State Cannabis Market Emphasis on limited-license jurisdictions Better operating environment for tenant More value created for real estate 116 54 33 22 20 OR WA MA MO PA IL FL Est. # of Licenses Operating1 1,275 1,021 10.3x
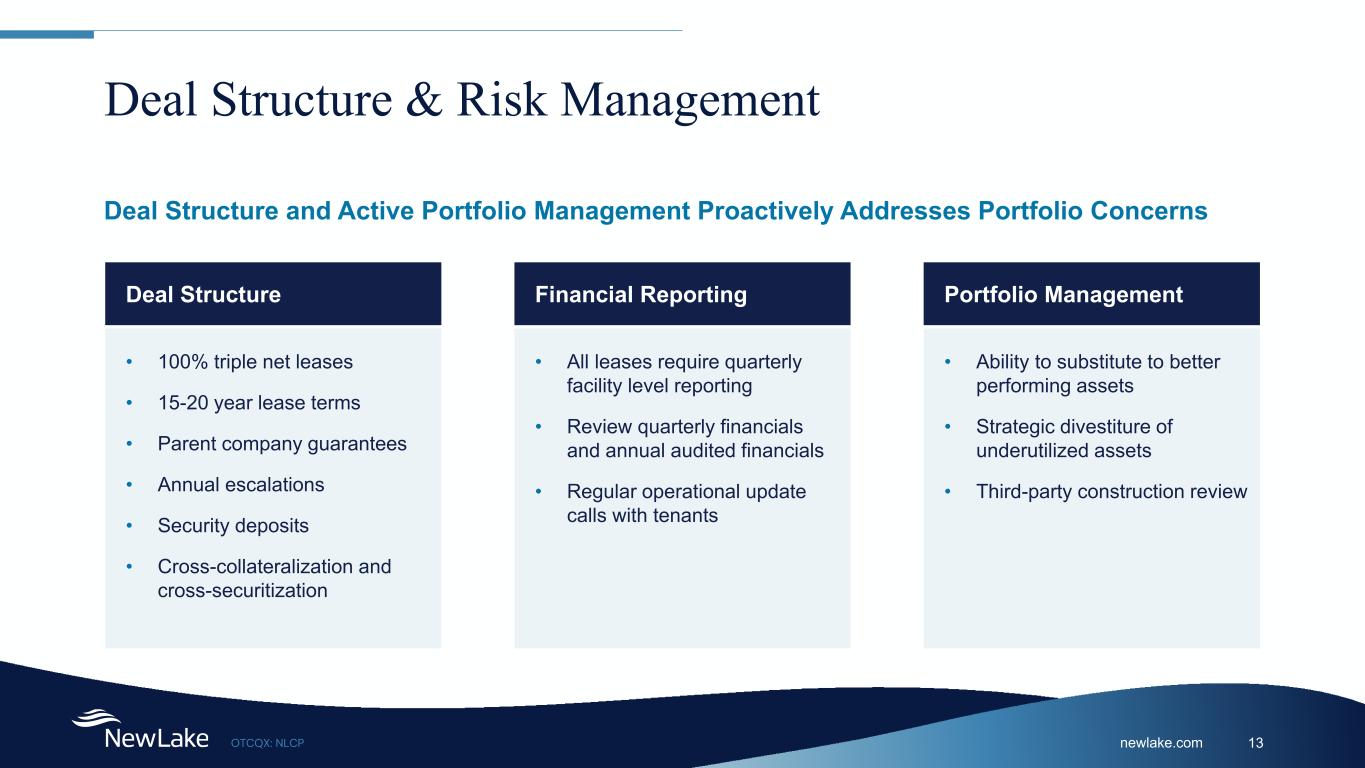
newlake.comOTCQX: NLCP 13 Deal Structure & Risk Management Deal Structure • 100% triple net leases • 15-20 year lease terms • Parent company guarantees • Annual escalations • Security deposits • Cross-collateralization and cross-securitization • Ability to substitute to better performing assets • Strategic divestiture of underutilized assets • Third-party construction review Financial Reporting Portfolio Management • All leases require quarterly facility level reporting • Review quarterly financials and annual audited financials • Regular operational update calls with tenants Deal Structure and Active Portfolio Management Proactively Addresses Portfolio Concerns
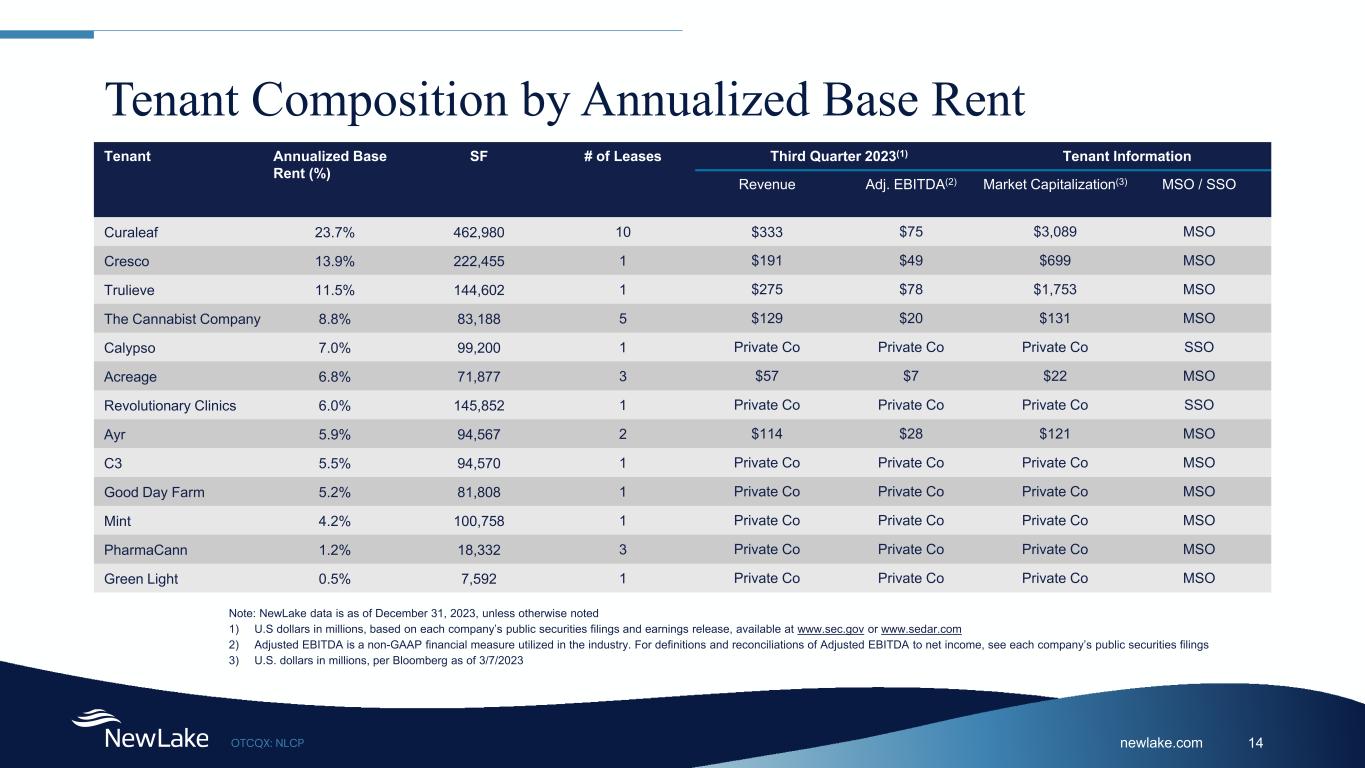
newlake.comOTCQX: NLCP 14 Tenant Composition by Annualized Base Rent Tenant Annualized Base Rent (%) SF # of Leases Third Quarter 2023(1) Tenant Information Revenue Adj. EBITDA(2) Market Capitalization(3) MSO / SSO Curaleaf 23.7% 462,980 10 $333 $75 $3,089 MSO Cresco 13.9% 222,455 1 $191 $49 $699 MSO Trulieve 11.5% 144,602 1 $275 $78 $1,753 MSO The Cannabist Company 8.8% 83,188 5 $129 $20 $131 MSO Calypso 7.0% 99,200 1 Private Co Private Co Private Co SSO Acreage 6.8% 71,877 3 $57 $7 $22 MSO Revolutionary Clinics 6.0% 145,852 1 Private Co Private Co Private Co SSO Ayr 5.9% 94,567 2 $114 $28 $121 MSO C3 5.5% 94,570 1 Private Co Private Co Private Co MSO Good Day Farm 5.2% 81,808 1 Private Co Private Co Private Co MSO Mint 4.2% 100,758 1 Private Co Private Co Private Co MSO PharmaCann 1.2% 18,332 3 Private Co Private Co Private Co MSO Green Light 0.5% 7,592 1 Private Co Private Co Private Co MSO Note: NewLake data is as of December 31, 2023, unless otherwise noted 1) U.S dollars in millions, based on each company’s public securities filings and earnings release, available at www.sec.gov or www.sedar.com 2) Adjusted EBITDA is a non-GAAP financial measure utilized in the industry. For definitions and reconciliations of Adjusted EBITDA to net income, see each company’s public securities filings 3) U.S. dollars in millions, per Bloomberg as of 3/7/2023
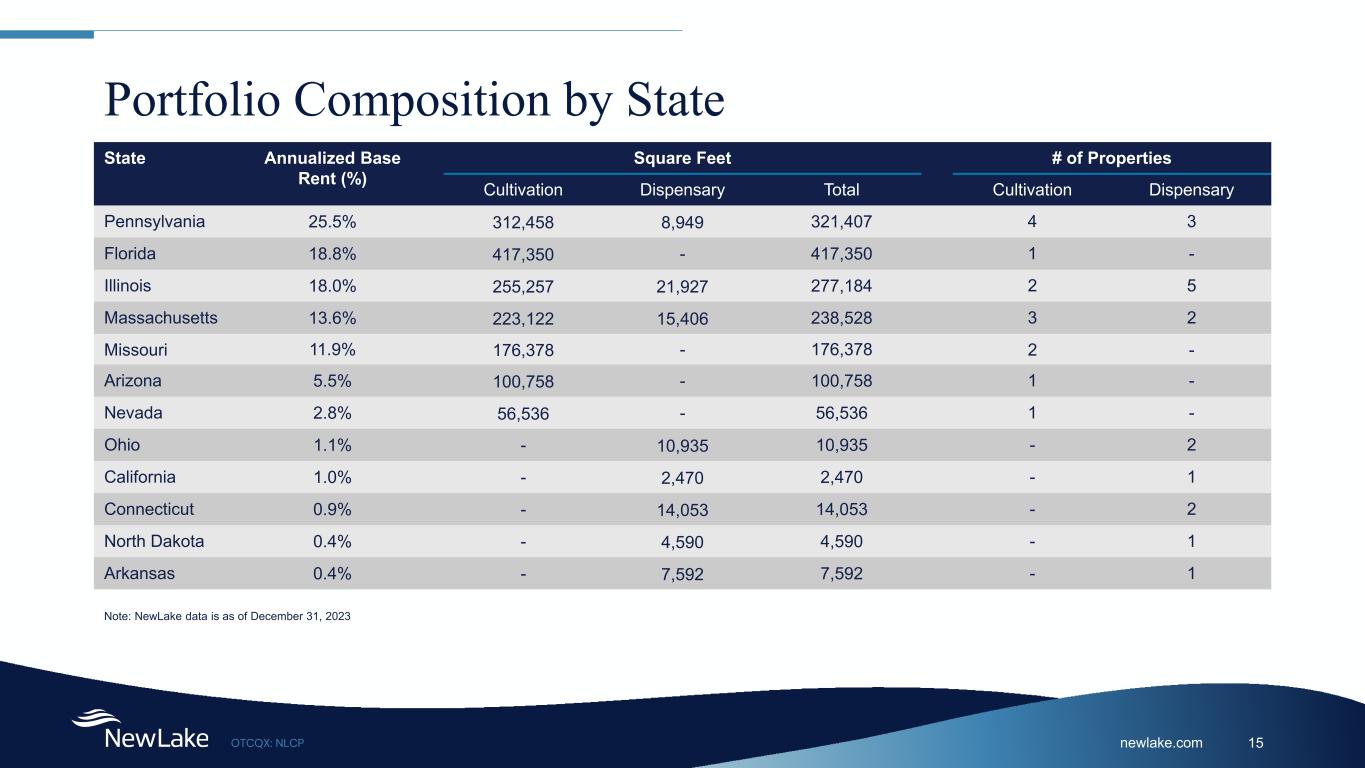
newlake.comOTCQX: NLCP 15 Portfolio Composition by State State Annualized Base Rent (%) Square Feet # of Properties Cultivation Dispensary Total Cultivation Dispensary Pennsylvania 25.5% 312,458 8,949 321,407 4 3 Florida 18.8% 417,350 - 417,350 1 - Illinois 18.0% 255,257 21,927 277,184 2 5 Massachusetts 13.6% 223,122 15,406 238,528 3 2 Missouri 11.9% 176,378 - 176,378 2 - Arizona 5.5% 100,758 - 100,758 1 - Nevada 2.8% 56,536 - 56,536 1 - Ohio 1.1% - 10,935 10,935 - 2 California 1.0% - 2,470 2,470 - 1 Connecticut 0.9% - 14,053 14,053 - 2 North Dakota 0.4% - 4,590 4,590 - 1 Arkansas 0.4% - 7,592 7,592 - 1 Note: NewLake data is as of December 31, 2023
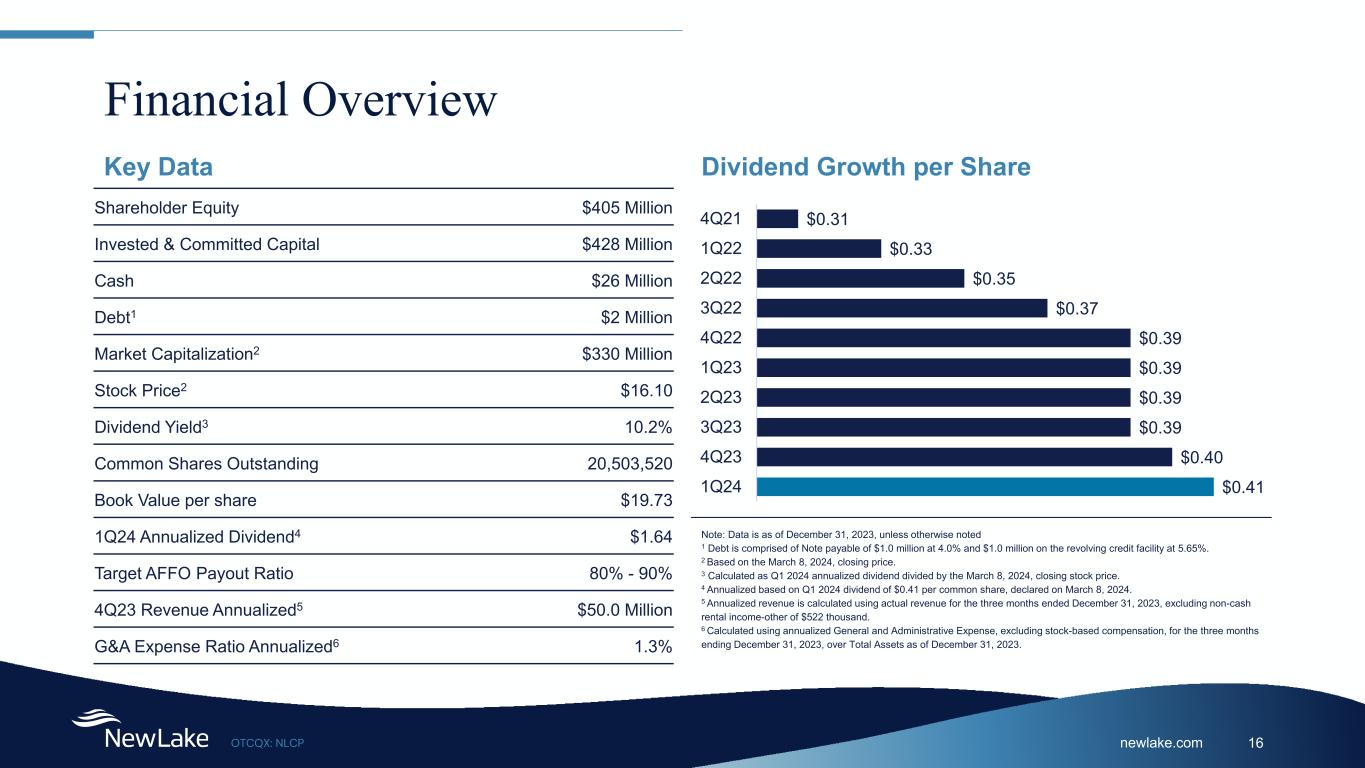
newlake.comOTCQX: NLCP 16 Financial Overview Shareholder Equity $405 Million Invested & Committed Capital $428 Million Cash $26 Million Debt1 $2 Million Market Capitalization2 $330 Million Stock Price2 $16.10 Dividend Yield3 10.2% Common Shares Outstanding 20,503,520 Book Value per share $19.73 1Q24 Annualized Dividend4 $1.64 Target AFFO Payout Ratio 80% - 90% 4Q23 Revenue Annualized5 $50.0 Million G&A Expense Ratio Annualized6 1.3% Key Data Dividend Growth per Share Note: Data is as of December 31, 2023, unless otherwise noted 1 Debt is comprised of Note payable of $1.0 million at 4.0% and $1.0 million on the revolving credit facility at 5.65%. 2 Based on the March 8, 2024, closing price. 3 Calculated as Q1 2024 annualized dividend divided by the March 8, 2024, closing stock price. 4 Annualized based on Q1 2024 dividend of $0.41 per common share, declared on March 8, 2024. 5 Annualized revenue is calculated using actual revenue for the three months ended December 31, 2023, excluding non-cash rental income-other of $522 thousand. 6 Calculated using annualized General and Administrative Expense, excluding stock-based compensation, for the three months ending December 31, 2023, over Total Assets as of December 31, 2023. $0.41 $0.40 $0.39 $0.39 $0.39 $0.39 $0.37 $0.35 $0.33 $0.31 1Q24 4Q23 3Q23 2Q23 1Q23 4Q22 3Q22 2Q22 1Q22 4Q21
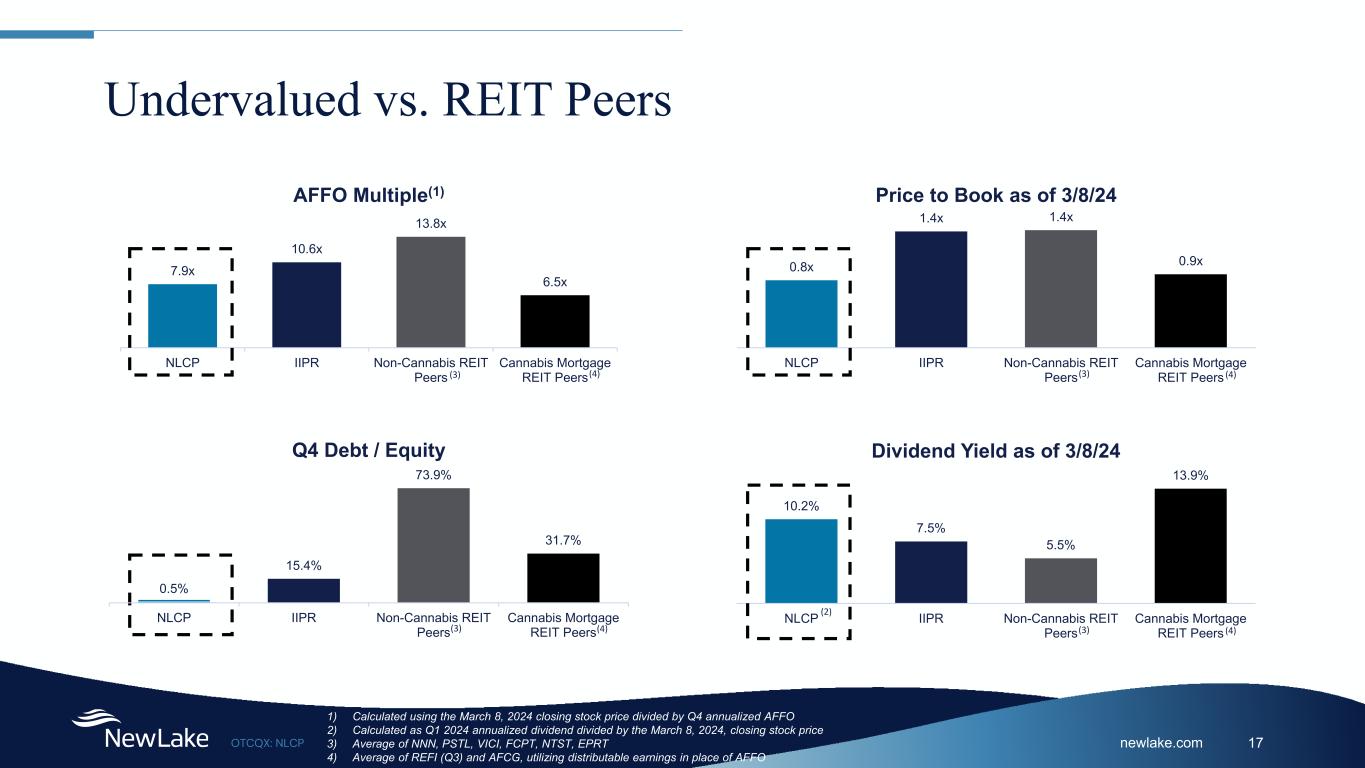
newlake.comOTCQX: NLCP 17 Undervalued vs. REIT Peers 1) Calculated using the March 8, 2024 closing stock price divided by Q4 annualized AFFO 2) Calculated as Q1 2024 annualized dividend divided by the March 8, 2024, closing stock price 3) Average of NNN, PSTL, VICI, FCPT, NTST, EPRT 4) Average of REFI (Q3) and AFCG, utilizing distributable earnings in place of AFFO 7.9x 10.6x 13.8x 6.5x NLCP IIPR Non-Cannabis REIT Peers Cannabis Mortgage REIT Peers AFFO Multiple(1) 0.8x 1.4x 1.4x 0.9x NLCP IIPR Non-Cannabis REIT Peers Cannabis Mortgage REIT Peers Price to Book as of 3/8/24 10.2% 7.5% 5.5% 13.9% NLCP IIPR Non-Cannabis REIT Peers Cannabis Mortgage REIT Peers Dividend Yield as of 3/8/24 (3) (3) (3) (3) (4) (4) (4) (4) 0.5% 15.4% 73.9% 31.7% NLCP IIPR Non-Cannabis REIT Peers Cannabis Mortgage REIT Peers Q4 Debt / Equity (2)
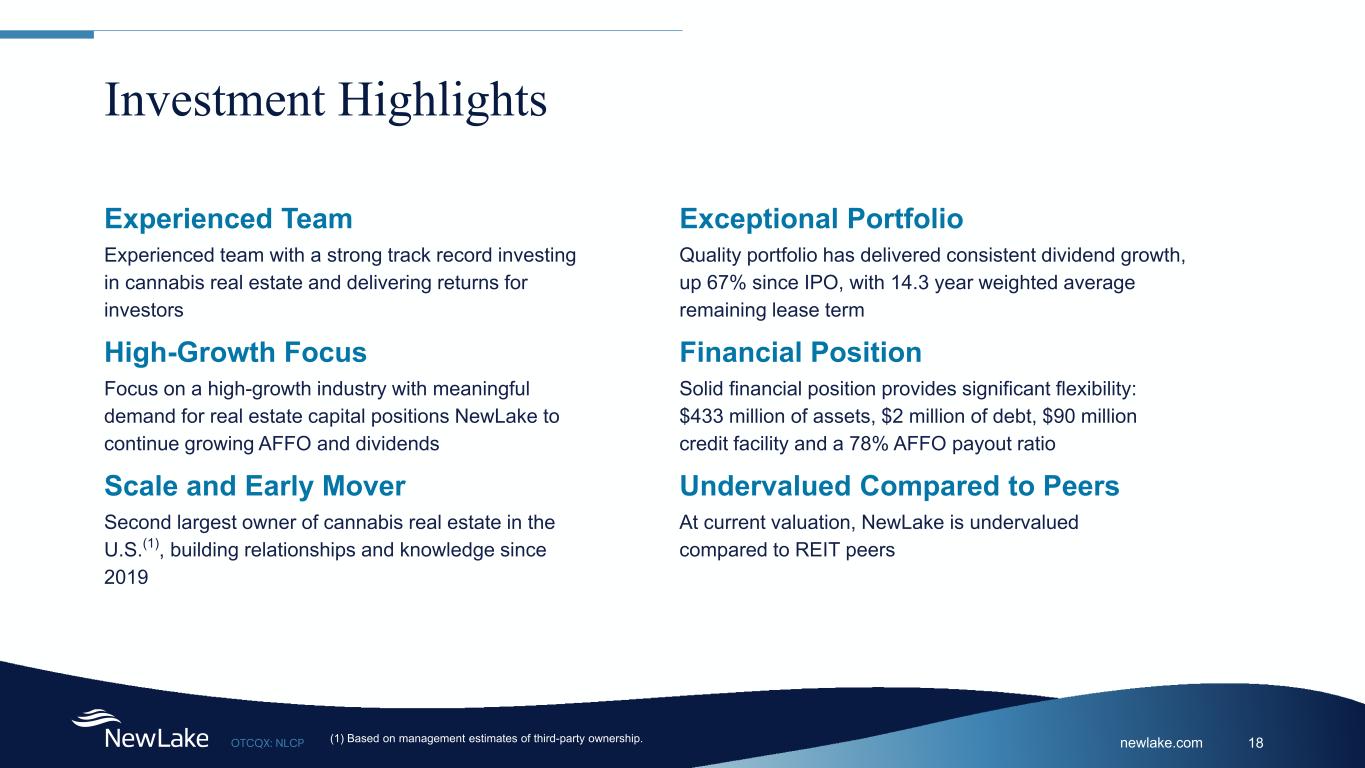
newlake.comOTCQX: NLCP 18 Investment Highlights Experienced Team Experienced team with a strong track record investing in cannabis real estate and delivering returns for investors High-Growth Focus Focus on a high-growth industry with meaningful demand for real estate capital positions NewLake to continue growing AFFO and dividends Scale and Early Mover Second largest owner of cannabis real estate in the U.S.(1), building relationships and knowledge since 2019 Exceptional Portfolio Quality portfolio has delivered consistent dividend growth, up 67% since IPO, with 14.3 year weighted average remaining lease term Financial Position Solid financial position provides significant flexibility: $433 million of assets, $2 million of debt, $90 million credit facility and a 78% AFFO payout ratio Undervalued Compared to Peers At current valuation, NewLake is undervalued compared to REIT peers (1) Based on management estimates of third-party ownership.

Supplemental Information
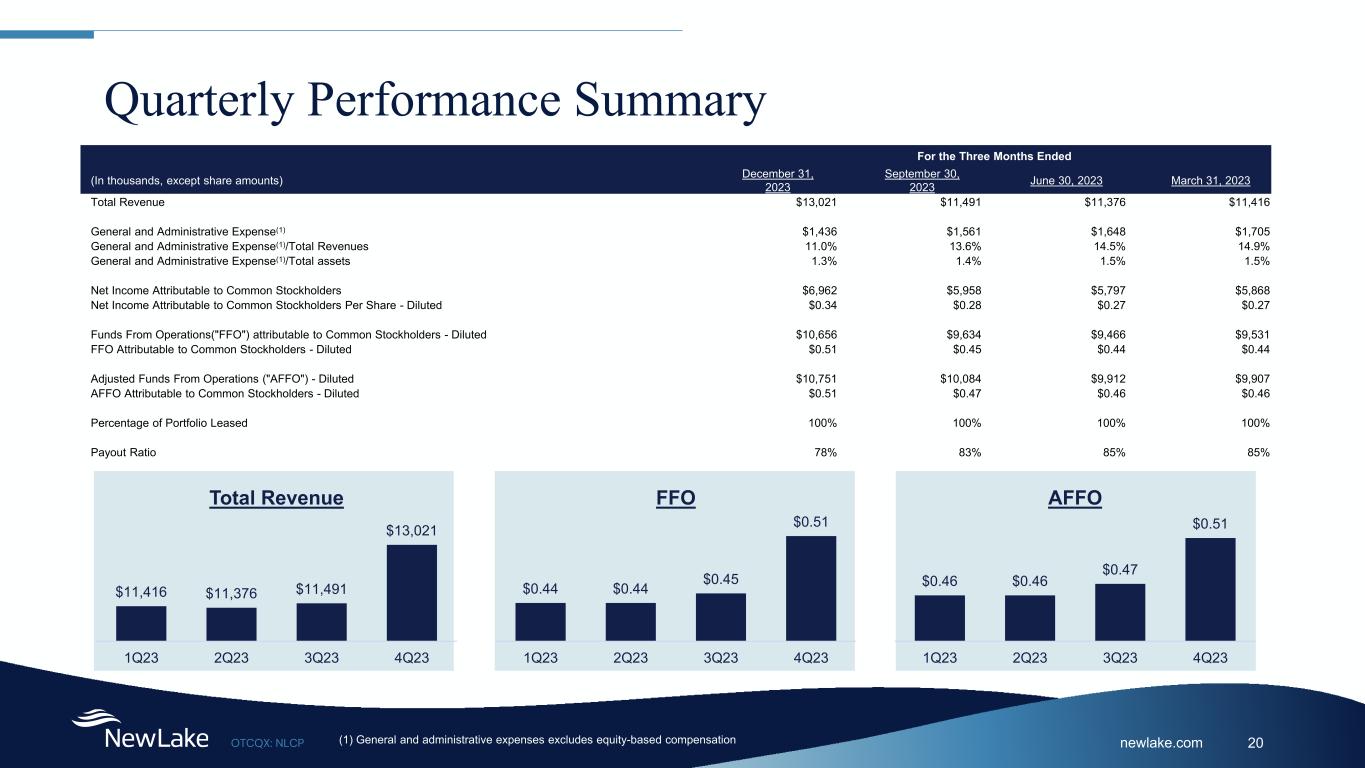
newlake.comOTCQX: NLCP 20 Quarterly Performance Summary For the Three Months Ended (In thousands, except share amounts) December 31, 2023 September 30, 2023 June 30, 2023 March 31, 2023 Total Revenue $13,021 $11,491 $11,376 $11,416 General and Administrative Expense(1) $1,436 $1,561 $1,648 $1,705 General and Administrative Expense(1)/Total Revenues 11.0% 13.6% 14.5% 14.9% General and Administrative Expense(1)/Total assets 1.3% 1.4% 1.5% 1.5% Net Income Attributable to Common Stockholders $6,962 $5,958 $5,797 $5,868 Net Income Attributable to Common Stockholders Per Share - Diluted $0.34 $0.28 $0.27 $0.27 Funds From Operations("FFO") attributable to Common Stockholders - Diluted $10,656 $9,634 $9,466 $9,531 FFO Attributable to Common Stockholders - Diluted $0.51 $0.45 $0.44 $0.44 Adjusted Funds From Operations ("AFFO") - Diluted $10,751 $10,084 $9,912 $9,907 AFFO Attributable to Common Stockholders - Diluted $0.51 $0.47 $0.46 $0.46 Percentage of Portfolio Leased 100% 100% 100% 100% Payout Ratio 78% 83% 85% 85% (1) General and administrative expenses excludes equity-based compensation $11,416 $11,376 $11,491 $13,021 1Q23 2Q23 3Q23 4Q23 Total Revenue $0.44 $0.44 $0.45 $0.51 1Q23 2Q23 3Q23 4Q23 FFO $0.46 $0.46 $0.47 $0.51 1Q23 2Q23 3Q23 4Q23 AFFO
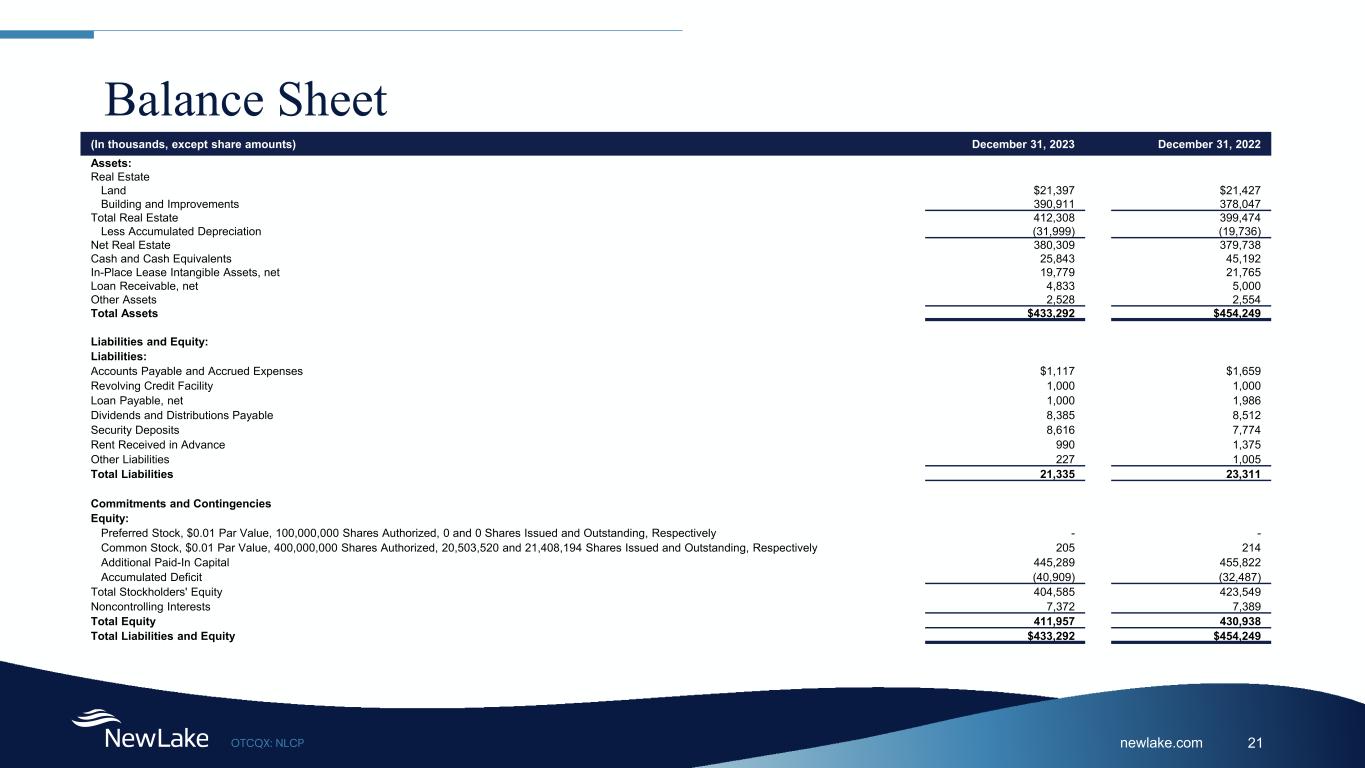
newlake.comOTCQX: NLCP 21 Balance Sheet (In thousands, except share amounts) December 31, 2023 December 31, 2022 Assets: Real Estate Land $21,397 $21,427 Building and Improvements 390,911 378,047 Total Real Estate 412,308 399,474 Less Accumulated Depreciation (31,999) (19,736) Net Real Estate 380,309 379,738 Cash and Cash Equivalents 25,843 45,192 In-Place Lease Intangible Assets, net 19,779 21,765 Loan Receivable, net 4,833 5,000 Other Assets 2,528 2,554 Total Assets $433,292 $454,249 Liabilities and Equity: Liabilities: Accounts Payable and Accrued Expenses $1,117 $1,659 Revolving Credit Facility 1,000 1,000 Loan Payable, net 1,000 1,986 Dividends and Distributions Payable 8,385 8,512 Security Deposits 8,616 7,774 Rent Received in Advance 990 1,375 Other Liabilities 227 1,005 Total Liabilities 21,335 23,311 Commitments and Contingencies Equity: Preferred Stock, $0.01 Par Value, 100,000,000 Shares Authorized, 0 and 0 Shares Issued and Outstanding, Respectively - - Common Stock, $0.01 Par Value, 400,000,000 Shares Authorized, 20,503,520 and 21,408,194 Shares Issued and Outstanding, Respectively 205 214 Additional Paid-In Capital 445,289 455,822 Accumulated Deficit (40,909) (32,487) Total Stockholders' Equity 404,585 423,549 Noncontrolling Interests 7,372 7,389 Total Equity 411,957 430,938 Total Liabilities and Equity $433,292 $454,249
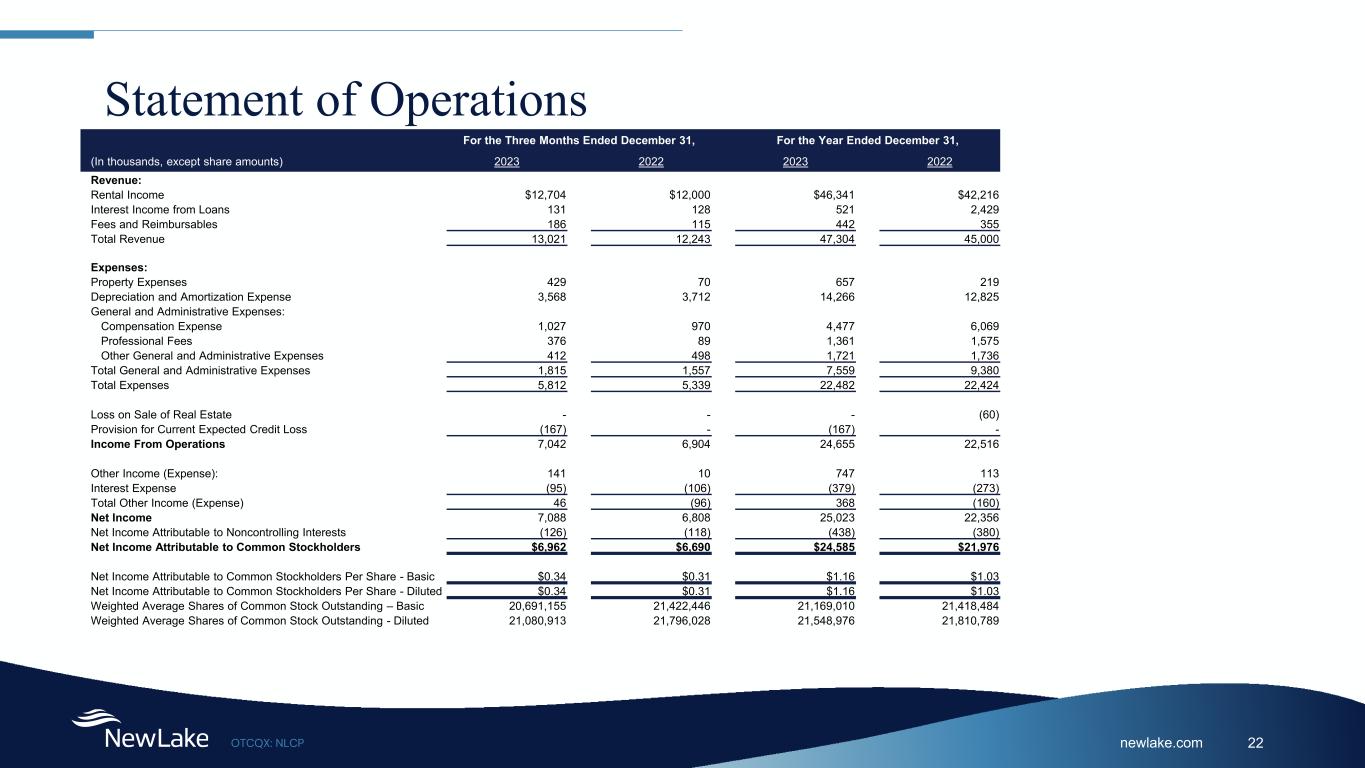
newlake.comOTCQX: NLCP 22 Statement of Operations For the Three Months Ended December 31, For the Year Ended December 31, (In thousands, except share amounts) 2023 2022 2023 2022 Revenue: Rental Income $12,704 $12,000 $46,341 $42,216 Interest Income from Loans 131 128 521 2,429 Fees and Reimbursables 186 115 442 355 Total Revenue 13,021 12,243 47,304 45,000 Expenses: Property Expenses 429 70 657 219 Depreciation and Amortization Expense 3,568 3,712 14,266 12,825 General and Administrative Expenses: Compensation Expense 1,027 970 4,477 6,069 Professional Fees 376 89 1,361 1,575 Other General and Administrative Expenses 412 498 1,721 1,736 Total General and Administrative Expenses 1,815 1,557 7,559 9,380 Total Expenses 5,812 5,339 22,482 22,424 Loss on Sale of Real Estate - - - (60) Provision for Current Expected Credit Loss (167) - (167) - Income From Operations 7,042 6,904 24,655 22,516 Other Income (Expense): 141 10 747 113 Interest Expense (95) (106) (379) (273) Total Other Income (Expense) 46 (96) 368 (160) Net Income 7,088 6,808 25,023 22,356 Net Income Attributable to Noncontrolling Interests (126) (118) (438) (380) Net Income Attributable to Common Stockholders $6,962 $6,690 $24,585 $21,976 Net Income Attributable to Common Stockholders Per Share - Basic $0.34 $0.31 $1.16 $1.03 Net Income Attributable to Common Stockholders Per Share - Diluted $0.34 $0.31 $1.16 $1.03 Weighted Average Shares of Common Stock Outstanding – Basic 20,691,155 21,422,446 21,169,010 21,418,484 Weighted Average Shares of Common Stock Outstanding - Diluted 21,080,913 21,796,028 21,548,976 21,810,789

newlake.comOTCQX: NLCP 23 Non-GAAP Financial Information For the Three Months Ended December 31, For the Year Ended December 31, (In thousands, except share amounts) 2023 2022 2023 2022 Net Income Attributable to Common Stockholders $6,962 $6,690 $24,585 $21,976 Net Income Attributable to Noncontrolling Interests 126 118 438 380 Net Income attributable to common stockholders - diluted 7,088 6,808 25,023 22,356 Adjustments: Real Estate Depreciation and Amortization 3,568 3,712 14,266 12,825 Loss on Sale of Real Estate - - - 60 FFO Attributable to Common Stockholders – diluted $10,656 $10,520 $39,289 $35,241 Severance - - - 1,752 Non-Cash Rental Income - Other (522) - (522) - Provision for Current Expected Credit Loss 167 - 167 - Stock-Based Compensation 379 292 1,439 1,493 Non-Cash Interest Expense 71 70 282 163 Amortization of Straight-Line Rent Expense - - (1) 12 AFFO Attributable to Common Stockholders - diluted $10,751 $10,882 $40,654 $38,661 FFO per share – diluted $0.51 $0.48 $1.82 $1.62 AFFO per share – diluted $0.51 $0.50 $1.89 $1.77 The table below is a reconciliation of net income attributable to common stockholders to FFO and AFFO for the three and twelve months ended December 31, 2023, and 2022 (in thousands, except share and per share amounts)
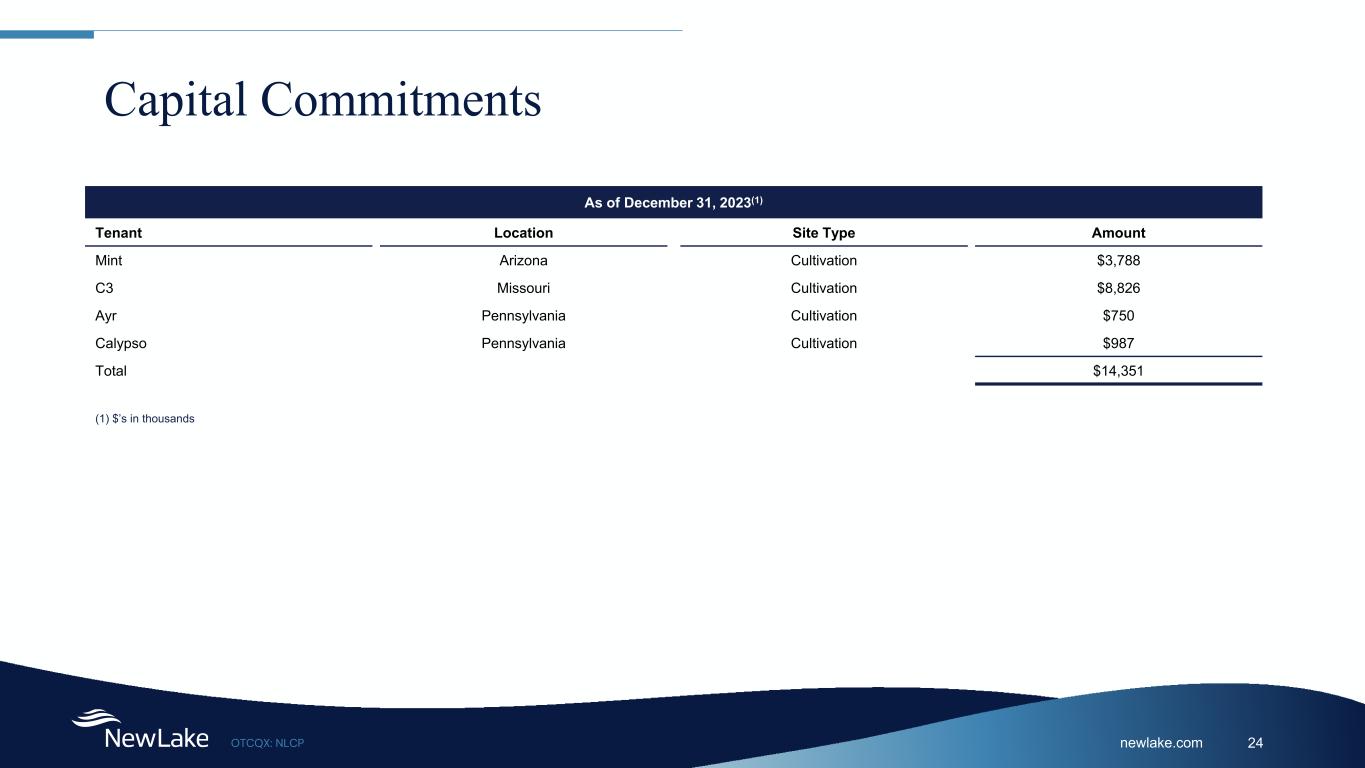
newlake.comOTCQX: NLCP 24 Capital Commitments As of December 31, 2023(1) Tenant Location Site Type Amount Mint Arizona Cultivation $3,788 C3 Missouri Cultivation $8,826 Ayr Pennsylvania Cultivation $750 Calypso Pennsylvania Cultivation $987 Total $14,351 (1) $’s in thousands
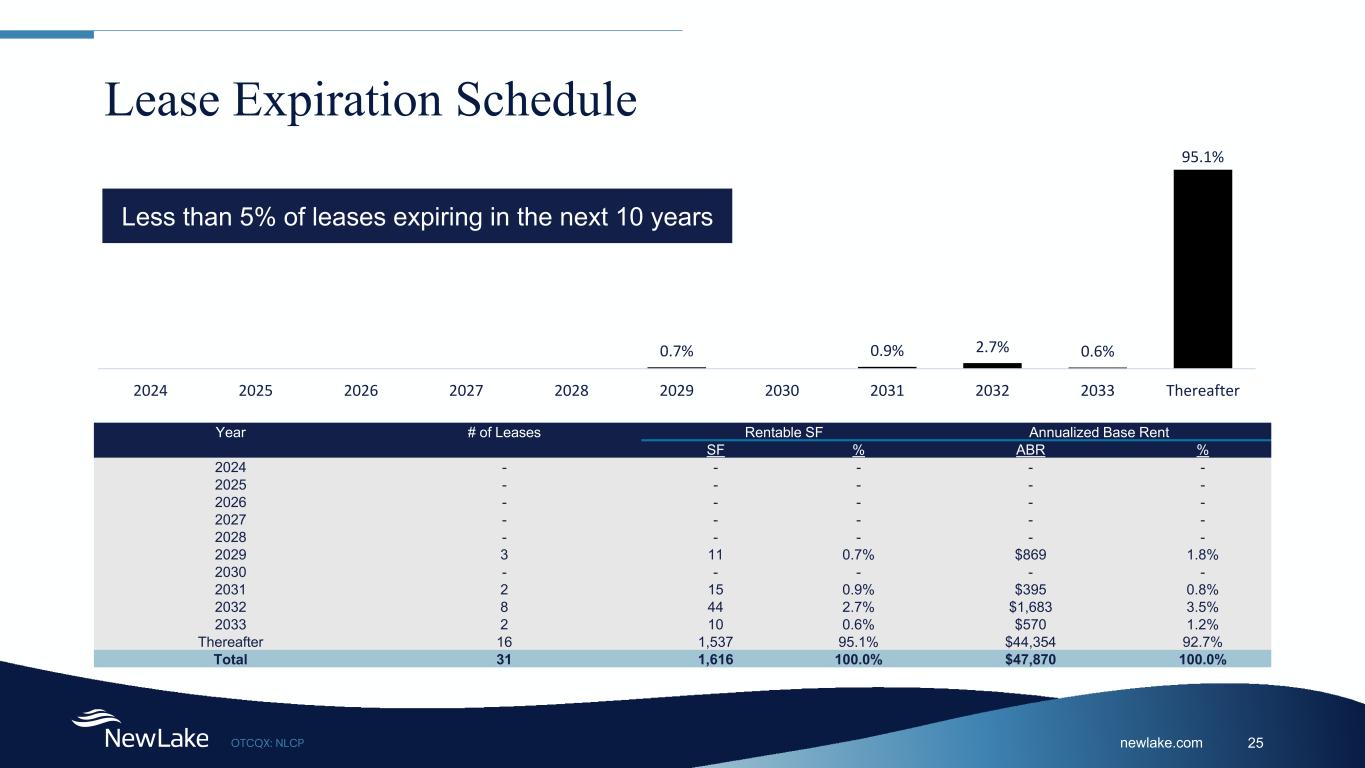
newlake.comOTCQX: NLCP 25 Lease Expiration Schedule 0.7% 0.9% 2.7% 0.6% 95.1% 2024 2025 2026 2027 2028 2029 2030 2031 2032 2033 Thereafter Less than 5% of leases expiring in the next 10 years Year # of Leases Rentable SF Annualized Base Rent SF % ABR % 2024 - - - - - 2025 - - - - - 2026 - - - - - 2027 - - - - - 2028 - - - - - 2029 3 11 0.7% $869 1.8% 2030 - - - - - 2031 2 15 0.9% $395 0.8% 2032 8 44 2.7% $1,683 3.5% 2033 2 10 0.6% $570 1.2% Thereafter 16 1,537 95.1% $44,354 92.7% Total 31 1,616 100.0% $47,870 100.0%

newlake.comOTCQX: NLCP 26 Cultivation Property List Tenant State City Date Acquired % Leased Square Feet Invested / Committed Capital $ In Place Under Development Invested Committed Total $ Total $ PSF Acreage Massachusetts Sterling 10/31/2019 100% 38,380 $9,787,999 - $9,787,999 $255 Acreage Pennsylvania Sinking Springs 10/31/2019 100% 30,625 $10,158,372 - $10,158,372 $332 Ayr Pennsylvania Pottsville 6/30/2022 100% 38,031 $14,528,586 $750,000 $15,278,586 $402 Ayr Nevada Sparks 6/30/2022 100% 56,536 $13,578,804 - $13,578,804 $240 C3 Missouri O'Fallon 4/1/2022 100% 40,700 53,870 $25,173,664 $8,826,336 $34,000,000 $360 Calypso Pennsylvania Erie 11/1/2021 100% 99,200 $32,013,378 $986,623 $33,000,000 $333 The Cannabist Company Illinois Aurora 12/23/2019 100% 32,802 $11,469,139 - $11,469,139 $350 The Cannabist Company Massachusetts Lowell 12/23/2019 100% 38,890 $14,777,302 - $14,777,302 $380 Cresco Illinois Lincoln 12/31/2019 100% 222,455 $50,677,821 - $50,677,821 $228 Curaleaf Florida Mt. Dora 8/31/2021 100% 417,350 $75,983,217 - $75,983,217 $182 Good Day Farm Missouri Chaffee 12/20/2021 100% 81,808 $21,132,965 $21,132,965 $258 Mint Arizona Phoenix 3/30/2021 100% - 100,758 $17,226,847 $3,788,421 $21,015,268 $209 Revolutionary Clinics Massachusetts Fitchburg 6/30/2026 100% 145,852 $42,275,000 - $42,275,000 $290 Trulieve Pennsylvania Mckeesport 10/31/2019 100% 144,602 $41,500,000 - $41,500,000 $287
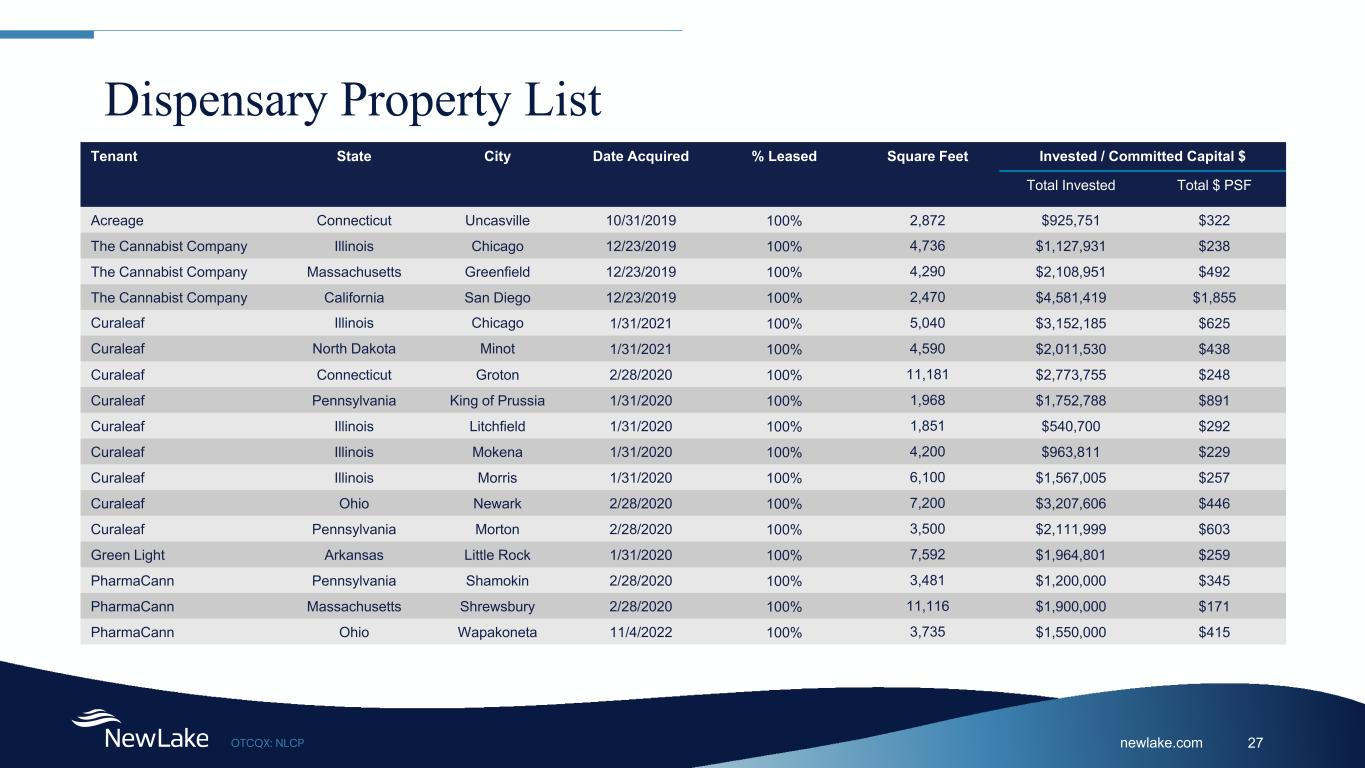
newlake.comOTCQX: NLCP 27 Dispensary Property List Tenant State City Date Acquired % Leased Square Feet Invested / Committed Capital $ Total Invested Total $ PSF Acreage Connecticut Uncasville 10/31/2019 100% 2,872 $925,751 $322 The Cannabist Company Illinois Chicago 12/23/2019 100% 4,736 $1,127,931 $238 The Cannabist Company Massachusetts Greenfield 12/23/2019 100% 4,290 $2,108,951 $492 The Cannabist Company California San Diego 12/23/2019 100% 2,470 $4,581,419 $1,855 Curaleaf Illinois Chicago 1/31/2021 100% 5,040 $3,152,185 $625 Curaleaf North Dakota Minot 1/31/2021 100% 4,590 $2,011,530 $438 Curaleaf Connecticut Groton 2/28/2020 100% 11,181 $2,773,755 $248 Curaleaf Pennsylvania King of Prussia 1/31/2020 100% 1,968 $1,752,788 $891 Curaleaf Illinois Litchfield 1/31/2020 100% 1,851 $540,700 $292 Curaleaf Illinois Mokena 1/31/2020 100% 4,200 $963,811 $229 Curaleaf Illinois Morris 1/31/2020 100% 6,100 $1,567,005 $257 Curaleaf Ohio Newark 2/28/2020 100% 7,200 $3,207,606 $446 Curaleaf Pennsylvania Morton 2/28/2020 100% 3,500 $2,111,999 $603 Green Light Arkansas Little Rock 1/31/2020 100% 7,592 $1,964,801 $259 PharmaCann Pennsylvania Shamokin 2/28/2020 100% 3,481 $1,200,000 $345 PharmaCann Massachusetts Shrewsbury 2/28/2020 100% 11,116 $1,900,000 $171 PharmaCann Ohio Wapakoneta 11/4/2022 100% 3,735 $1,550,000 $415

Thank You Company Contact: Lisa Meyer CFO, Treasurer and Secretary Lmeyer@newlake.com Investor Relations Contact: Valter Pinto / Jack Perkins KCSA Strategic Communications NewLake@KCSA.com (212) 896-1254