
To State-Licensed Cannabis Operators A Leading Provider of Real Estate Capital
This presentation contains forward looking statements within the meaning of the U.S. Private Securities Litigation Reform Act of 1995. These statements can be identified by words like “may,” “will,” “would,” “should,” “could,” “likely,” “expect,” “anticipate,” “future,” “plan,” “believe,” “intend,” “goal,” “project,” “estimate,” “continue” and similar expressions. Forward-looking statements are neither historical facts nor assurances of future performance. Instead, they are based only on our current beliefs and expectations. Forward-looking statements are based on the Company’s future financial performance, business prospects and strategy current expectations and assumptions regarding capital market conditions, future dividend payments, anticipated financial position, the Company’s acquisition pipeline, liquidity and capital needs, the economy and other future conditions. Because forward-looking statements relate to the future, they are subject to inherent uncertainties, risks and changes in circumstances that are difficult to predict and many of which are outside of our control. Our actual results may differ materially from those expressed in, or implied by, the forward-looking statements. The Company is providing the information contained herein as of the date of this presentation. Except as required by applicable law, the Company does not plan to update or revise any statements contained herein, whether as a result of any new information, future events, changed circumstances or otherwise. Therefore, you should not rely on any of these forward-looking statements For a discussion of the risks and uncertainties which could cause actual results to differ from those contained in the forward-looking statements, see “Risk Factors” in our most recent Annual Report on Form 10-K and any subsequent Quarterly Reports on Form 10-Q. The Company does not undertake, and specifically disclaims any obligation, to publicly release the result of any revisions which may be made to any forward-looking statements to reflect the occurrence of anticipated or unanticipated events or circumstances after the date of such statements, except as required by law. Safe Harbor Statement newlake.com 2OTCQX: NLCP Use of Non-GAAP Financial Information Adjusted Funds From Operations (AFFO”) is a supplemental non-GAAP financial measure used in the real estate industry to measure and compare the operating performance of real estate companies. A complete reconciliation containing adjustments from GAAP net income attributable to common stockholders and participating securities to AFFO are included in the appendix to this presentation.
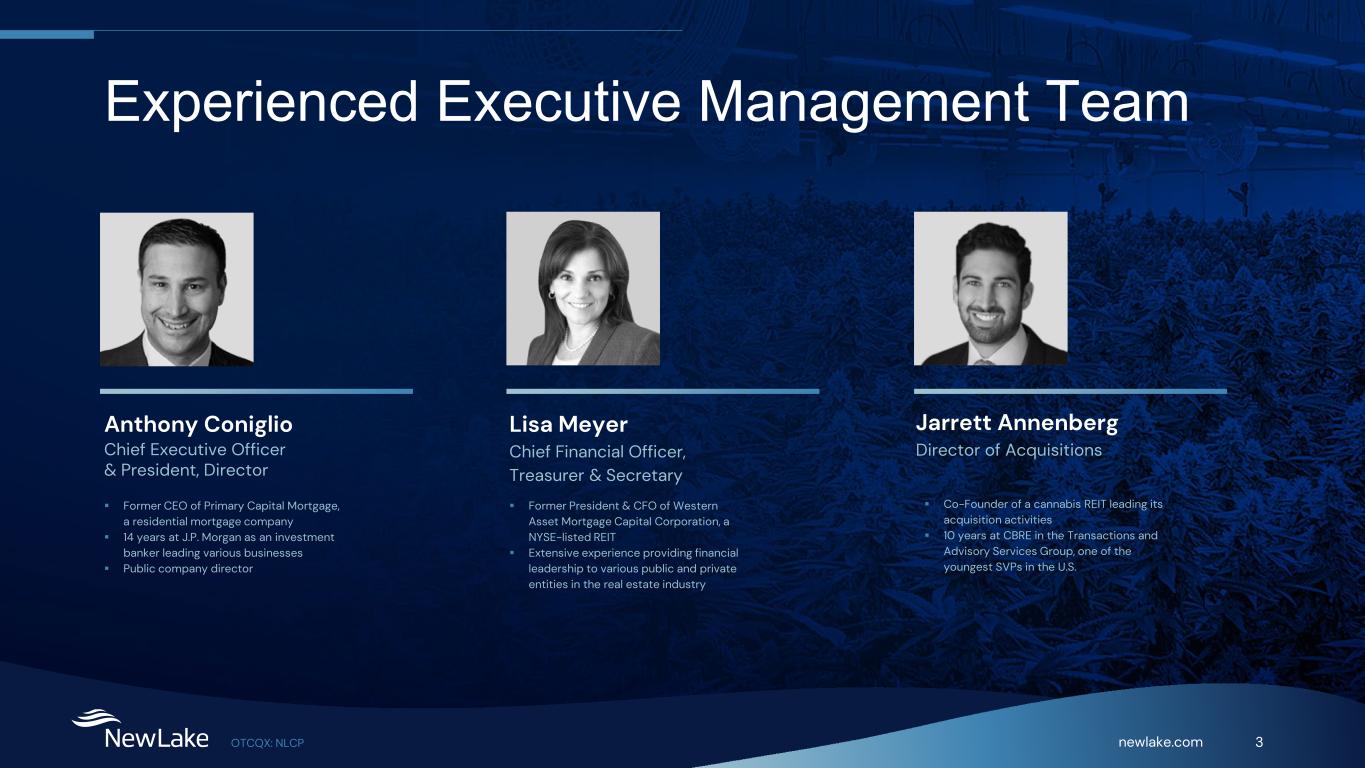
newlake.com 3OTCQX: NLCP Experienced Executive Management Team Anthony Coniglio Chief Executive Officer & President, Director Lisa Meyer Chief Financial Officer, Treasurer & Secretary Jarrett Annenberg Director of Acquisitions Former CEO of Primary Capital Mortgage, a residential mortgage company 14 years at J.P. Morgan as an investment banker leading various businesses Public company director Former President & CFO of Western Asset Mortgage Capital Corporation, a NYSE-listed REIT Extensive experience providing financial leadership to various public and private entities in the real estate industry Co-Founder of a cannabis REIT leading its acquisition activities 10 years at CBRE in the Transactions and Advisory Services Group, one of the youngest SVPs in the U.S.
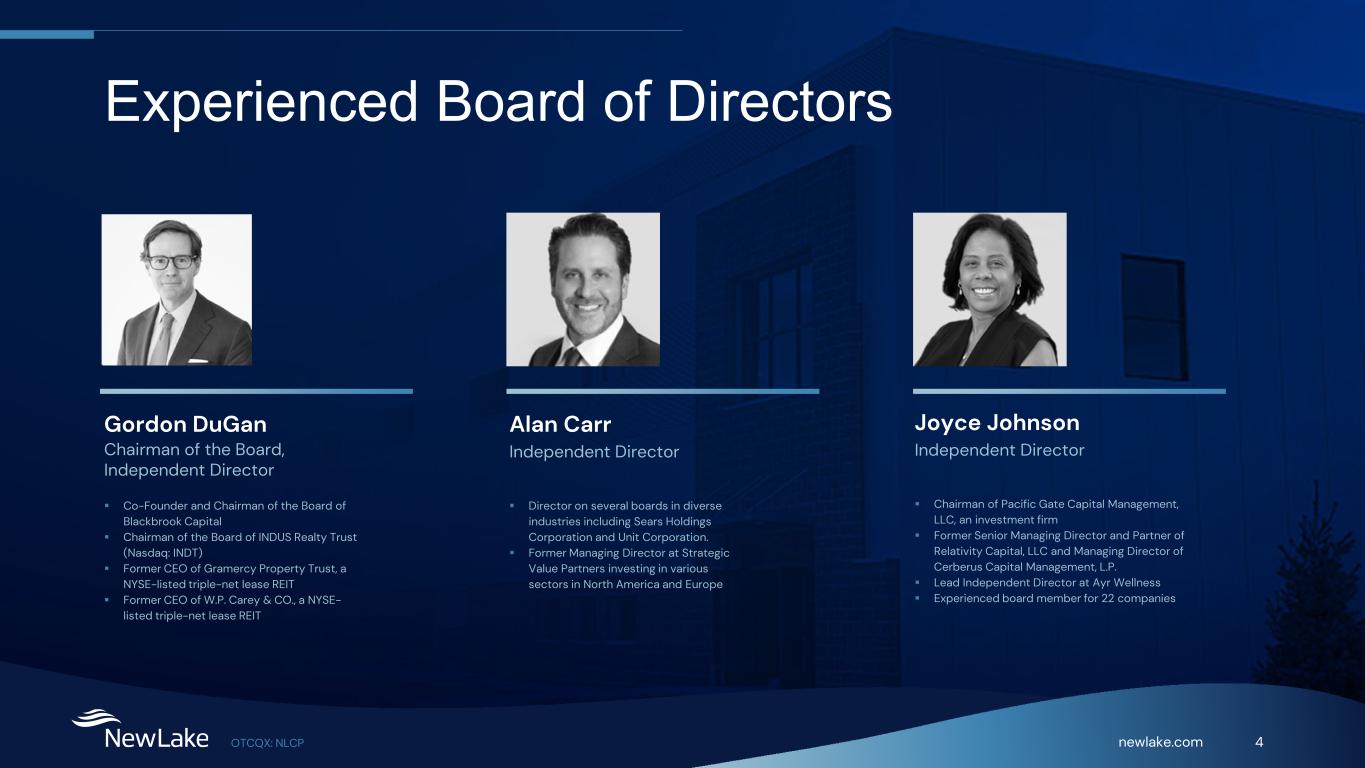
newlake.com 4OTCQX: NLCP Experienced Board of Directors Gordon DuGan Chairman of the Board, Independent Director Alan Carr Independent Director Joyce Johnson Independent Director Co-Founder and Chairman of the Board of Blackbrook Capital Chairman of the Board of INDUS Realty Trust (Nasdaq: INDT) Former CEO of Gramercy Property Trust, a NYSE-listed triple-net lease REIT Former CEO of W.P. Carey & CO., a NYSE- listed triple-net lease REIT Director on several boards in diverse industries including Sears Holdings Corporation and Unit Corporation. Former Managing Director at Strategic Value Partners investing in various sectors in North America and Europe Chairman of Pacific Gate Capital Management, LLC, an investment firm Former Senior Managing Director and Partner of Relativity Capital, LLC and Managing Director of Cerberus Capital Management, L.P. Lead Independent Director at Ayr Wellness Experienced board member for 22 companies
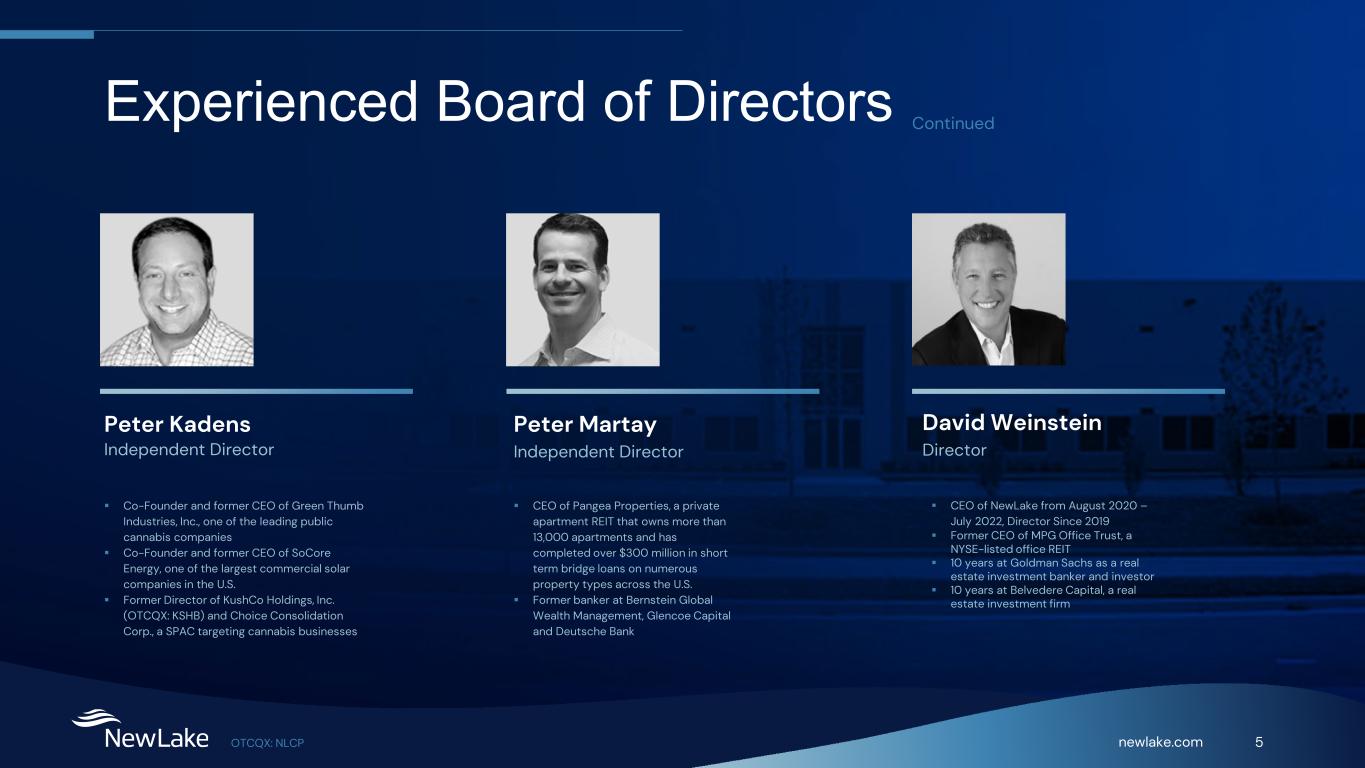
newlake.com 5OTCQX: NLCP Experienced Board of Directors Peter Kadens Independent Director Peter Martay Independent Director David Weinstein Director Co-Founder and former CEO of Green Thumb Industries, Inc., one of the leading public cannabis companies Co-Founder and former CEO of SoCore Energy, one of the largest commercial solar companies in the U.S. Former Director of KushCo Holdings, Inc. (OTCQX: KSHB) and Choice Consolidation Corp., a SPAC targeting cannabis businesses CEO of Pangea Properties, a private apartment REIT that owns more than 13,000 apartments and has completed over $300 million in short term bridge loans on numerous property types across the U.S. Former banker at Bernstein Global Wealth Management, Glencoe Capital and Deutsche Bank CEO of NewLake from August 2020 – July 2022, Director Since 2019 Former CEO of MPG Office Trust, a NYSE-listed office REIT 10 years at Goldman Sachs as a real estate investment banker and investor 10 years at Belvedere Capital, a real estate investment firm Continued
newlake.com 6OTCQX: NLCP 1. Long Term Opportunity 2. Investment Process Overview 3. Geographic Footprint Table of Contents
newlake.com 7OTCQX: NLCP Long Term Opportunity in Cannabis Real Estate Gordon DuGan Chairman of the Board of Directors
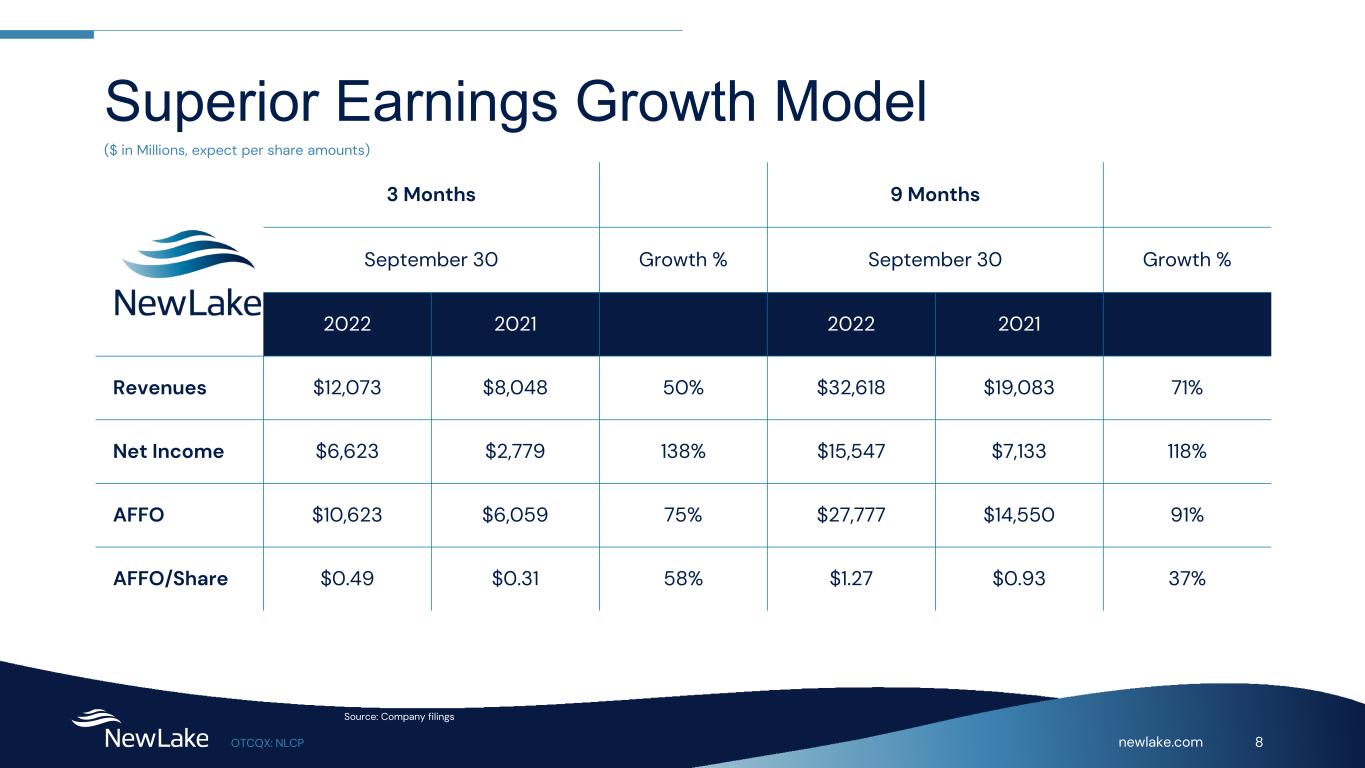
newlake.com 8OTCQX: NLCP Superior Earnings Growth Model 3 Months 9 Months September 30 Growth % September 30 Growth % 2022 2021 2022 2021 Revenues $12,073 $8,048 50% $32,618 $19,083 71% Net Income $6,623 $2,779 138% $15,547 $7,133 118% AFFO $10,623 $6,059 75% $27,777 $14,550 91% AFFO/Share $0.49 $0.31 58% $1.27 $0.93 37% ($ in Millions, expect per share amounts) Source: Company filings
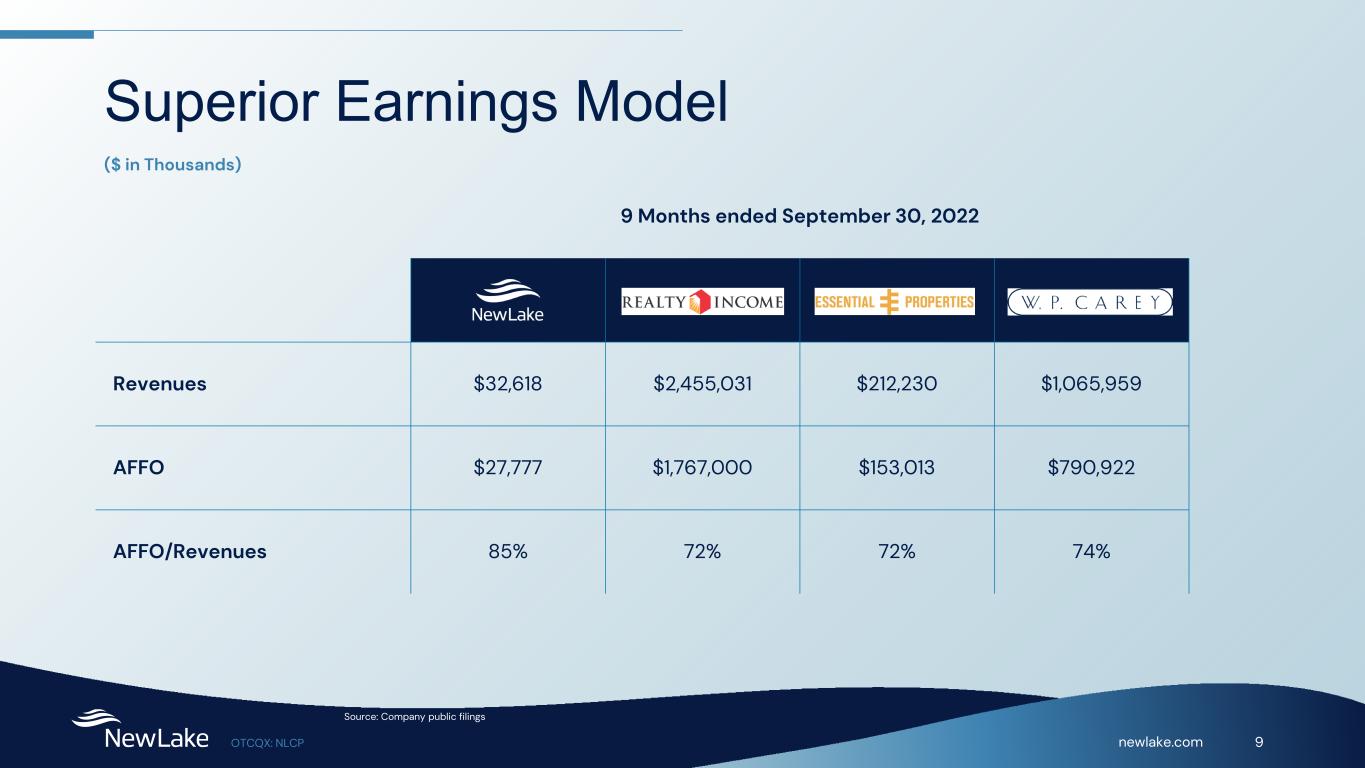
newlake.com 9OTCQX: NLCP Superior Earnings Model 9 Months ended September 30, 2022 Revenues $32,618 $2,455,031 $212,230 $1,065,959 AFFO $27,777 $1,767,000 $153,013 $790,922 AFFO/Revenues 85% 72% 72% 74% ($ in Thousands) Source: Company public filings
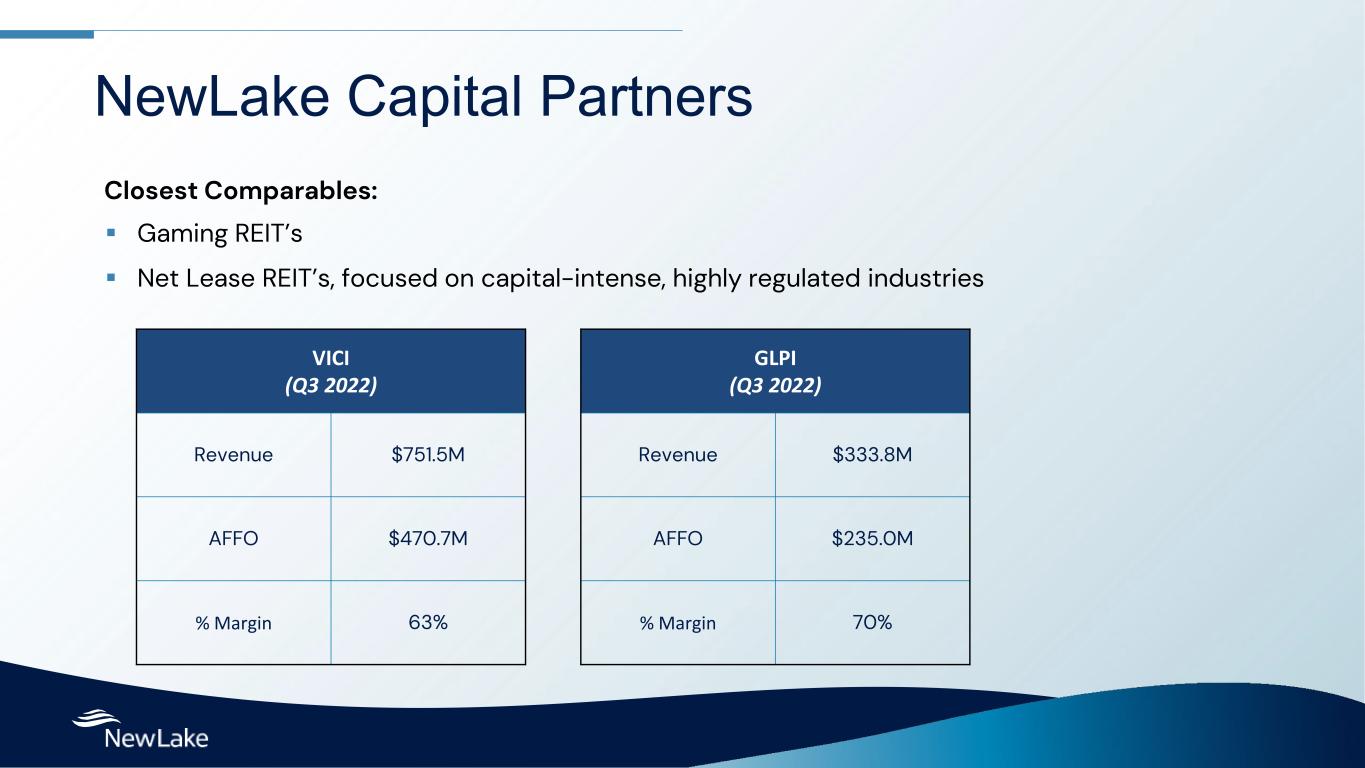
NewLake Capital Partners Gaming REIT’s Net Lease REIT’s, focused on capital-intense, highly regulated industries Closest Comparables: VICI (Q3 2022) Revenue $751.5M AFFO $470.7M % Margin 63% GLPI (Q3 2022) Revenue $333.8M AFFO $235.0M % Margin 70%
newlake.com 11OTCQX: NLCP Overview and Discussion of Investment Process Anthony Coniglio Chief Executive Officer & President, Director, NewLake
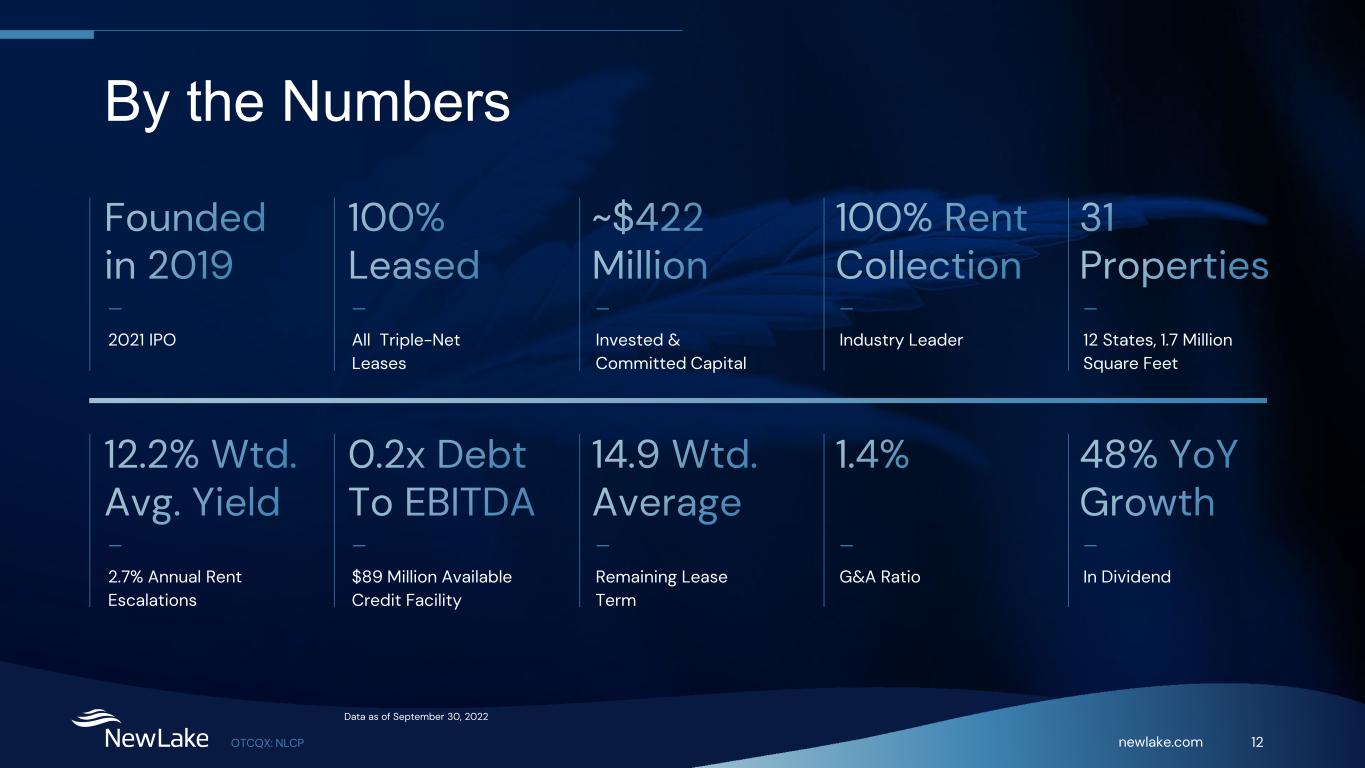
newlake.com 12OTCQX: NLCP — All Triple-Net Leases — 2021 IPO — Invested & Committed Capital — Industry Leader — 12 States, 1.7 Million Square Feet — $89 Million Available Credit Facility — 2.7% Annual Rent Escalations — Remaining Lease Term — G&A Ratio — In Dividend By the Numbers Data as of September 30, 2022
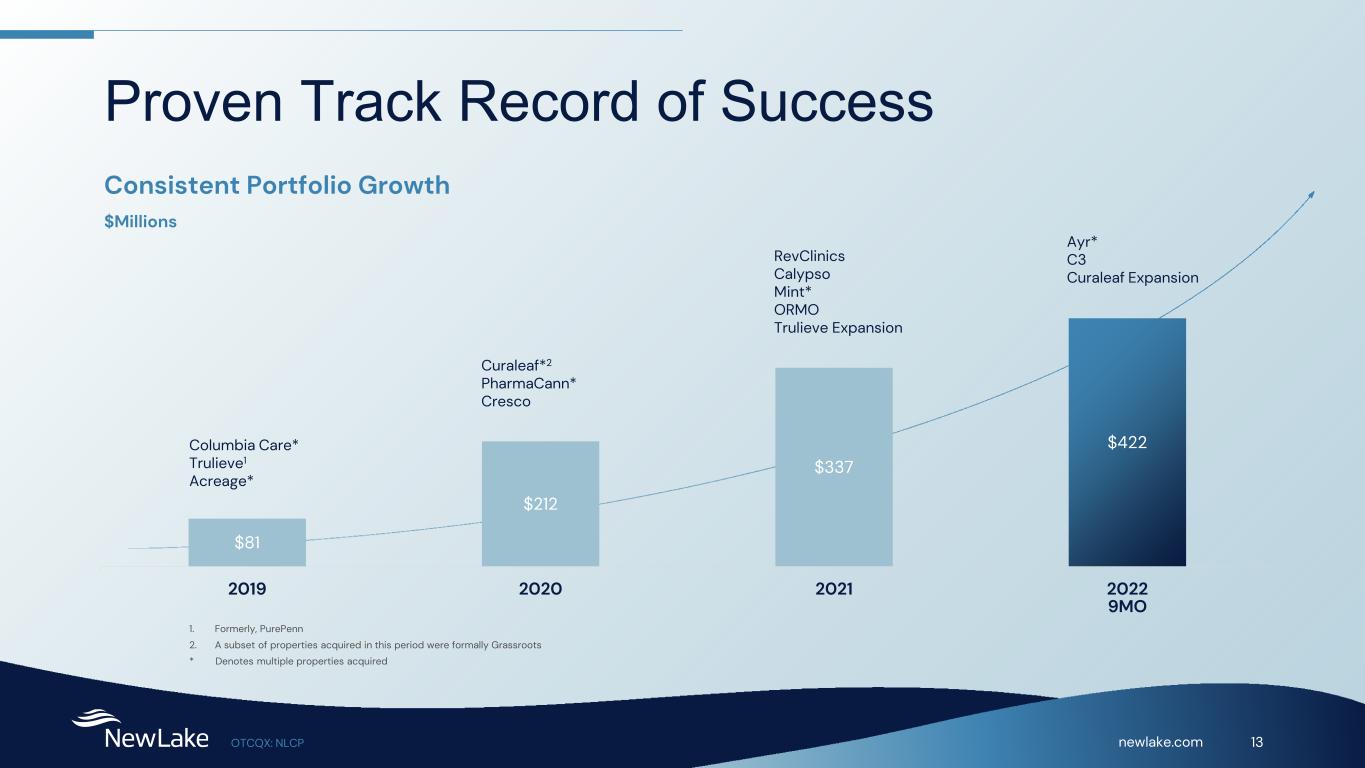
newlake.com 13OTCQX: NLCP Proven Track Record of Success $81 $212 $337 $422 2019 2020 2021 2022 1. Formerly, PurePenn 2. A subset of properties acquired in this period were formally Grassroots * Denotes multiple properties acquired Columbia Care* Trulieve1 Acreage* Curaleaf*2 PharmaCann* Cresco RevClinics Calypso Mint* ORMO Trulieve Expansion Ayr* C3 Curaleaf Expansion Consistent Portfolio Growth $Millions 9MO
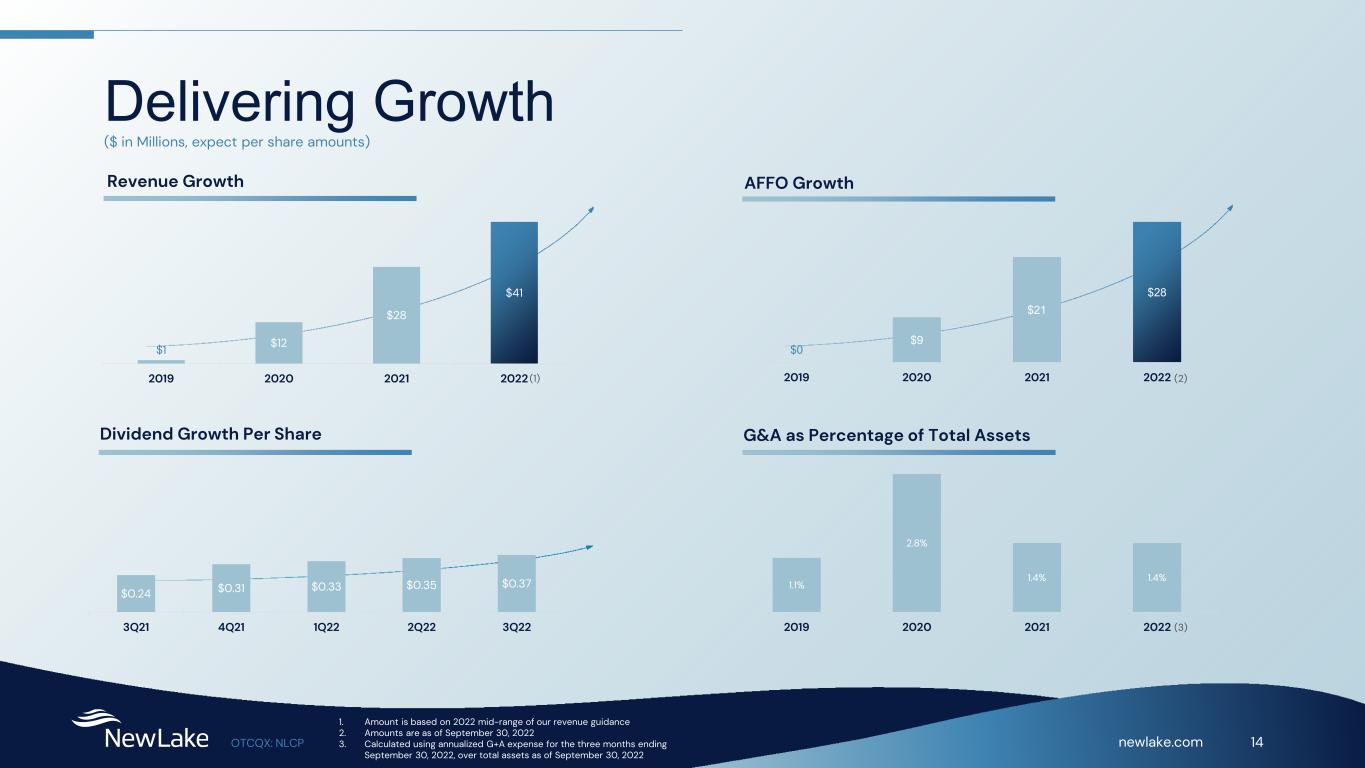
newlake.com 14OTCQX: NLCP Delivering Growth 1.1% 2.8% 1.4% 1.4% 2019 2020 2021 2022 G&A as Percentage of Total Assets $0 $9 $21 $28 2019 2020 2021 2022 AFFO Growth $1 $12 $28 $41 2019 2020 2021 2022 Revenue Growth ($ in Millions, expect per share amounts) $0.24 $0.31 $0.33 $0.35 $0.37 3Q21 4Q21 1Q22 2Q22 3Q22 Dividend Growth Per Share 1. Amount is based on 2022 mid-range of our revenue guidance 2. Amounts are as of September 30, 2022 3. Calculated using annualized G+A expense for the three months ending September 30, 2022, over total assets as of September 30, 2022 (1) (3) (2)

newlake.com 15OTCQX: NLCP NewLake Process Overview 8-12 Weeks Location Quality Financials Cashflow Deal Sourcing Screening Initial Deal Review Deal Structuring Deal Proposal / LOI Diligence Investment Committee Board of Directors
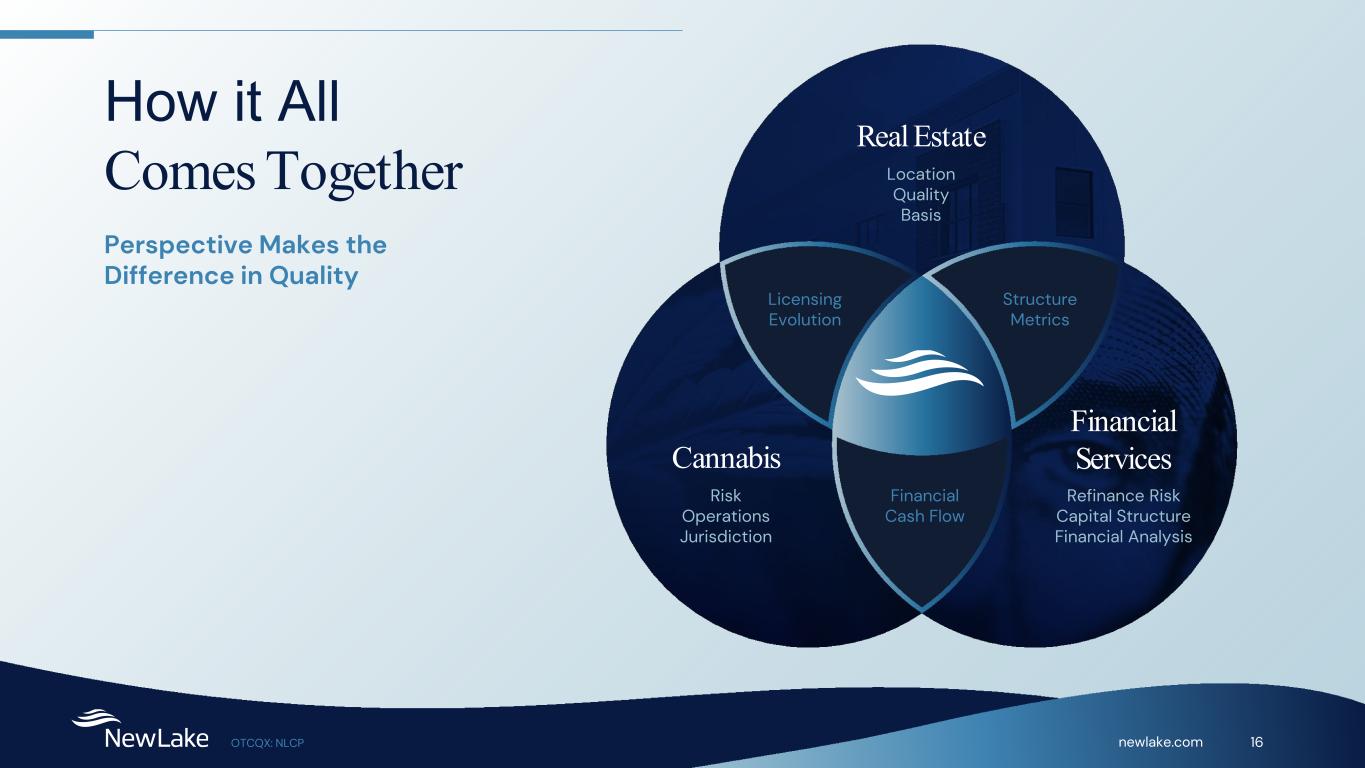
newlake.com 16OTCQX: NLCP How it All Comes Together Perspective Makes the Difference in Quality Real Estate Location Quality Basis Financial Services Refinance Risk Capital Structure Financial Analysis Cannabis Risk Operations Jurisdiction Financial Cash Flow Licensing Evolution Structure Metrics
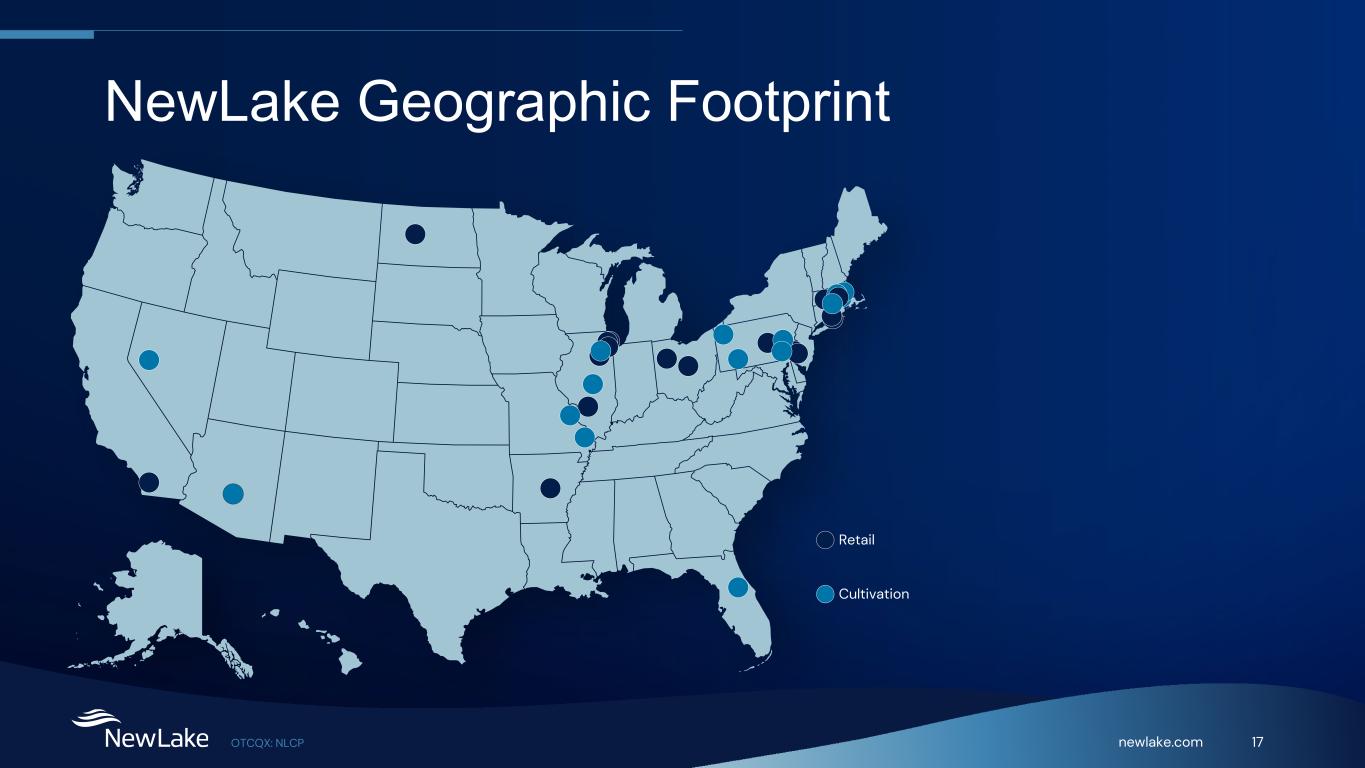
newlake.com 17OTCQX: NLCP NewLake Geographic Footprint Retail Cultivation
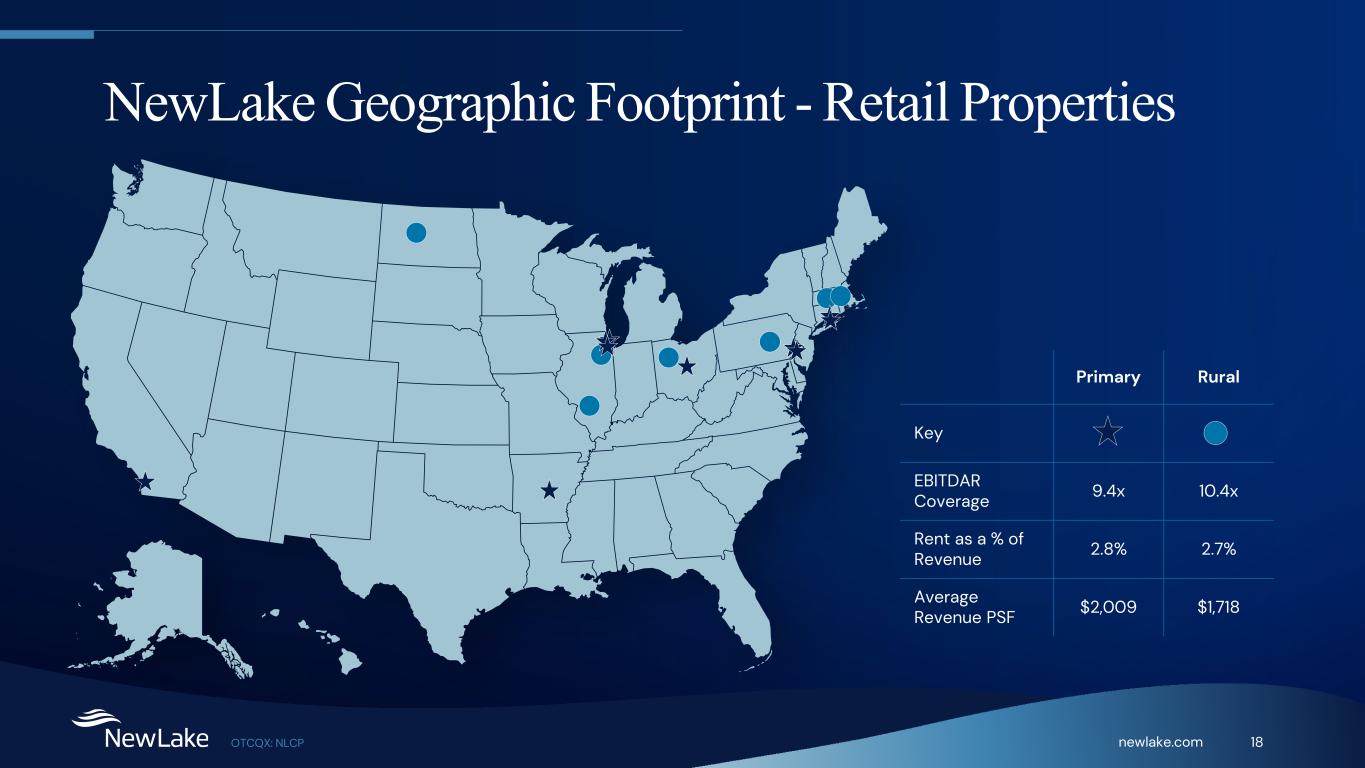
newlake.com 18OTCQX: NLCP Primary Rural Key EBITDAR Coverage 9.4x 10.4x Rent as a % of Revenue 2.8% 2.7% Average Revenue PSF $2,009 $1,718 NewLake Geographic Footprint - Retail Properties
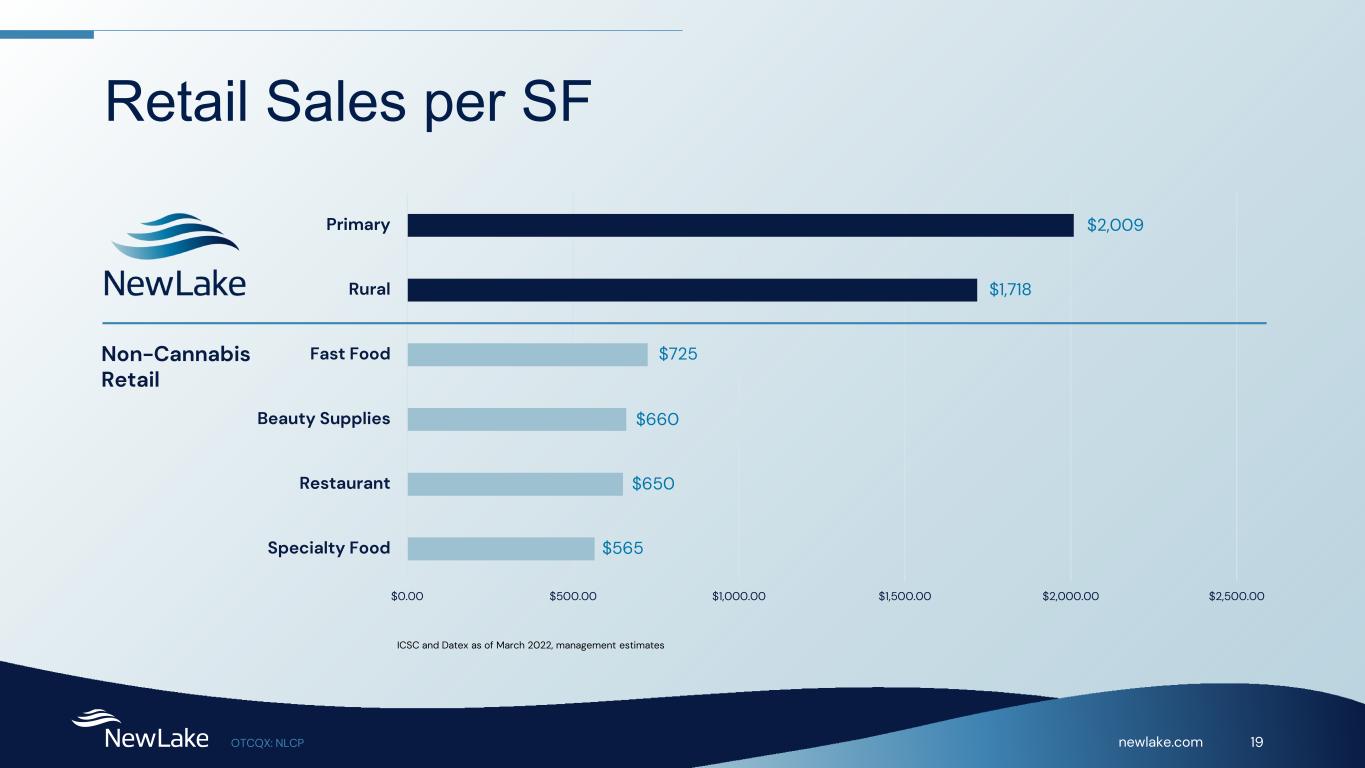
newlake.com 19OTCQX: NLCP Retail Sales per SF ICSC and Datex as of March 2022, management estimates $0.00 $500.00 $1,000.00 $1,500.00 $2,000.00 $2,500.00 Specialty Food Restaurant Beauty Supplies Fast Food Rural Primary $2,009 $1,718 $725 $660 $650 $565 Non-Cannabis Retail
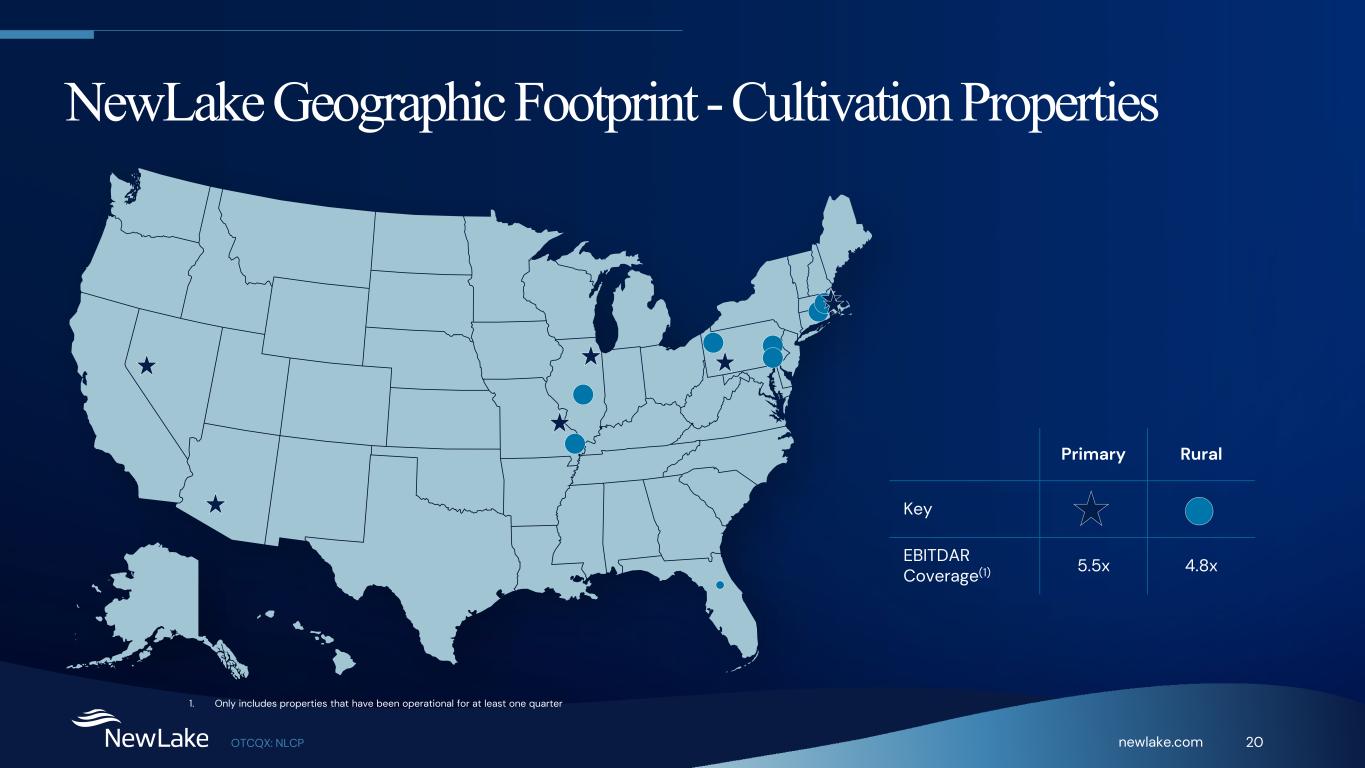
newlake.com 20OTCQX: NLCP Primary Rural Key EBITDAR Coverage(1) 5.5x 4.8x 1. Only includes properties that have been operational for at least one quarter NewLake Geographic Footprint - Cultivation Properties
Thank You Investor Relations Contact: Valter Pinto or Jack Perkins KCSA Strategic Communications NewLake@KCSA.com (212) 896-1254 Company Contact: Lisa Meyer CFO, Treasurer and Secretary Lmeyer@newlake.com
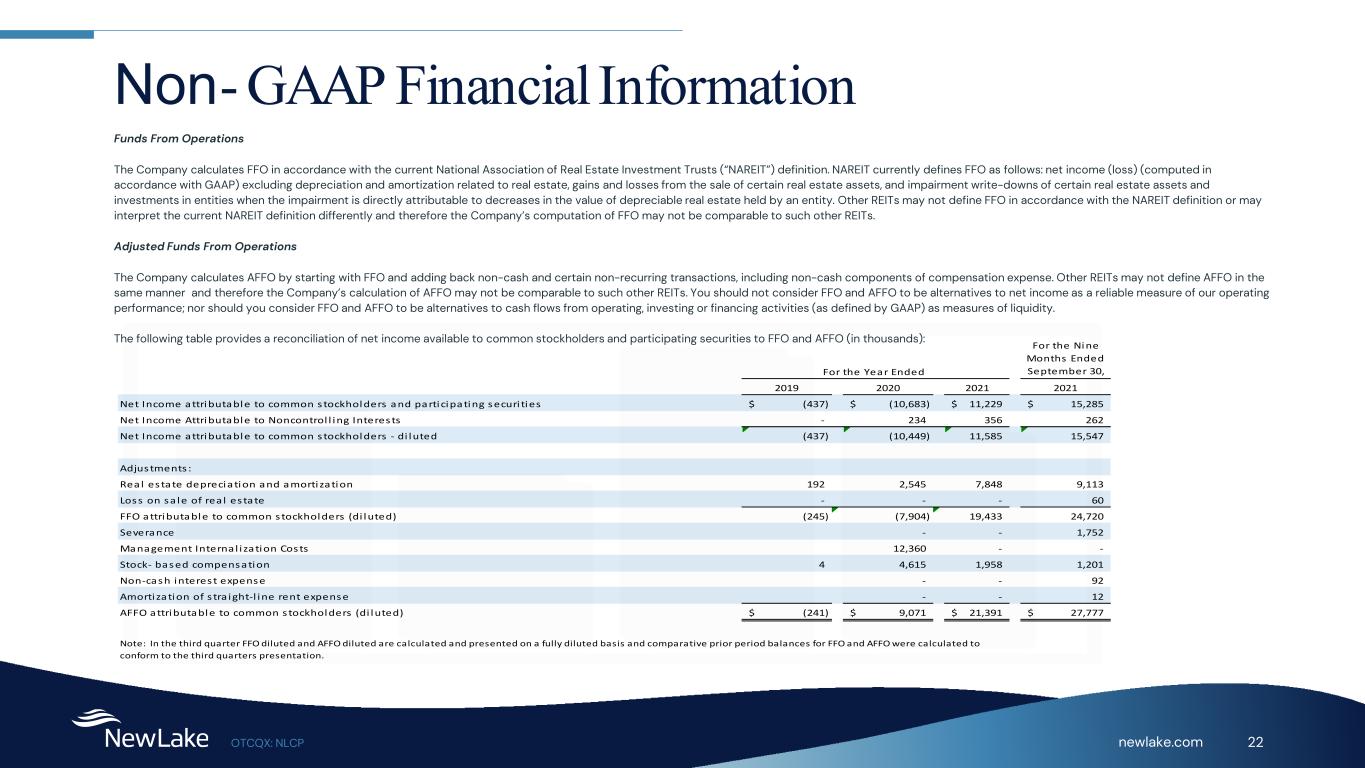
newlake.com 22OTCQX: NLCP Non - GAAP Financial Information Funds From Operations The Company calculates FFO in accordance with the current National Association of Real Estate Investment Trusts (“NAREIT”) definition. NAREIT currently defines FFO as follows: net income (loss) (computed in accordance with GAAP) excluding depreciation and amortization related to real estate, gains and losses from the sale of certain real estate assets, and impairment write-downs of certain real estate assets and investments in entities when the impairment is directly attributable to decreases in the value of depreciable real estate held by an entity. Other REITs may not define FFO in accordance with the NAREIT definition or may interpret the current NAREIT definition differently and therefore the Company’s computation of FFO may not be comparable to such other REITs. Adjusted Funds From Operations The Company calculates AFFO by starting with FFO and adding back non-cash and certain non-recurring transactions, including non-cash components of compensation expense. Other REITs may not define AFFO in the same manner and therefore the Company’s calculation of AFFO may not be comparable to such other REITs. You should not consider FFO and AFFO to be alternatives to net income as a reliable measure of our operating performance; nor should you consider FFO and AFFO to be alternatives to cash flows from operating, investing or financing activities (as defined by GAAP) as measures of liquidity. The following table provides a reconciliation of net income available to common stockholders and participating securities to FFO and AFFO (in thousands): For the Nine Months Ended September 30, 2019 2020 2021 2021 Net Income attributable to common stockholders and participating securi ties (437)$ (10,683)$ 11,229$ 15,285$ Net Income Attributable to Noncontrol l ing Interests - 234 356 262 Net Income attributable to common stockholders - di luted (437) (10,449) 11,585 15,547 Adjustments : Real estate depreciation and amortization 192 2,545 7,848 9,113 Loss on sa le of rea l es tate - - - 60 FFO attributable to common stockholders (di luted) (245) (7,904) 19,433 24,720 Severance - - 1,752 Management Internal i zation Costs 12,360 - - Stock- based compensation 4 4,615 1,958 1,201 Non-cash interest expense - - 92 Amortization of s tra ight-l ine rent expense - - 12 AFFO attributable to common stockholders (di luted) (241)$ 9,071$ 21,391$ 27,777$ For the Year Ended Note: In the third quarter FFO diluted and AFFO diluted are calculated and presented on a fully diluted basis and comparative prior period balances for FFO and AFFO were calculated to conform to the third quarters presentation.